Plant Available Potassium
Several decades ago it was assumed that the 'activity ratio' between the K+ activity and the Ca2+ plus Mg2+ activities in the soil solution would describe the K+ availability in soils according to the equation (102)AR = K+/√(Ca2+ Mg2+)
In diluted solutions such as the soil solution, the K+ activity is approximately the K+ concentration. It was found that this activity ratio does not reflect the K+ availability for plants (103). Of utmost importance for the K+ availability is the K+ concentration in the soil solution. The formula of the AR gives only the ratio and not the K+ activity or the K+ concentration. The K+ flux in soils depends on the diffusibility in the medium, which means it is strongly dependent on soil moisture and on the K+ concentration in the soil solution, as shown in the following formula (104):
J = D1 (dc1/dx) + D2(dc2/dx) + c3v;
where J is the K+ flux toward root surface, D1 the diffusion coefficient in the soil solution, c1 the K+ concentration in the soil solution, D2 the diffusion coefficient at interlayer surfaces, c2 the K+ concentration at the interlayer surface, x the distance, dc/dx the concentration gradient, c3 the K+ concentration in the mass flow water, and v the volume of the mass flow water.
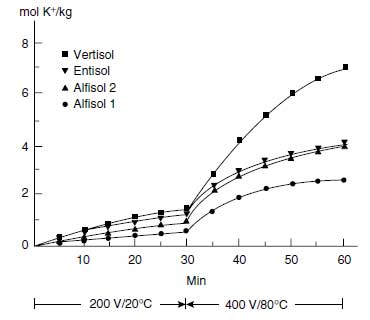 |
| FIGURE 4.10 Cumulative K+ extracted from four different soils by electro-ultra-filtration (EUF). First fraction extracted at 200 V and 20°C and the second fraction at 400 V and 80°C. (Adapted from K. Mengel and K. Uhlenbecker, Soil Sci. Soc. Am. J. 57:761-766, 1993.) |
The hydrated K+ adsorbed to the surfaces of the clay minerals can be desorbed quickly according to the equilibrium conditions, in contrast to the nonhydrated K+ of the interlayer, which has to diffuse to the edges of the interlayer. The diffusion coefficient of K+ in the interlayer is in the range of 10-13 m2/s, whereas the diffusion coefficient of K+ in the soil solution is about 10-9 m2/s (105). The distances in the interlayers, however, are relatively short, and the K+ concentrations are high. Therefore, appreciable amounts of K+ can be released by the interlayers. The K+ that is directly available is that of the soil solution, which may diffuse or be moved by mass flow to the root surface according to the equation shown above.
Growing roots represent a strong sink for K+ because of K+ uptake. Generally the K+ uptake rate is higher than the K+ diffusion, and thus a K+ depletion profile is produced with lowest K+ concentration at the root surface (106), as shown in Figure 4.11. This K+ concentration may be as low as 0.10 �M, whereas in the equilibrated soil solution K+, concentrations in the range of 500 �M prevail. Figure 4.11 shows such a depletion profile for exchangeable K+. From this figure it is also clear that higher the value of dc/dx the higher the level of exchangeable K+ (106). The K+ concentration at the root surface is decisive for the rate of K+ uptake according to the following equation (107):
Q = 2Πaact
where Q is the quantity of K+ absorbed per cm root length, a the root radius in cm, + the K+-absorbing power of the root, c the K+ concentration at the root surface, and t the time of nutrient absorption.
The K+-absorbing power of roots depends on the K+ nutritional status of roots; plants well supplied with K+ have a low absorbing power and vice versa. In addition, absorbing power depends also on the energy status of the root, and a low-energy status may even lead to K+ release by roots (19). The K+ concentration at the root surface also depends on the K+ buffer power of soils, which basically means the amount of adsorbed K+ that is in an equilibrated condition with the K+ in solution. The K+ buffer power is reflected by the plot of adsorbed K+ on the K+ concentration of the equilibrated soil solution, as shown in Figure 4.12. This relationship is known as the Quantity/Intensity relationship.
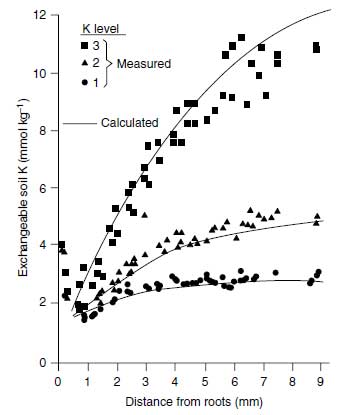 |
| FIGURE 4.11 Potassium depletion profile produced by young rape roots in a Luvisol with three K+ levels. (Adapted from A.O. Jungk, in Plant Roots, the Hidden Half. New York: Marcel Dekker, 2002, pp. 587-616.) |
(Q/I relationship) in which the quantity represents the adsorbed K+ (hydrated + nonhydrated K+), andthe intensity represents the K+ concentration in the equilibrated soil solution. As can be seen from Figure 4.12, the quantity per unit intensity is much higher for one soil than the other, and the 'high' soil has a higher potential to maintain the K+ concentration at the root surface at a high level than the 'medium' soil.
Support our developers


