Tissue Testing for Phosphorus
As noted previously, visual indications of phosphorus deficiency are seldom conclusive; consequently, accurate diagnosis typically requires a tissue test. Most diagnostic standards are generated using the theory of Macy (2), as noted previously concerning critical levels, sufficiency ranges, and poverty adjustment. In practice, critical levels or sufficiency ranges are usually determined by plotting final relative yield against phosphorus concentration in plant tissues and interpreting the resulting curvilinear function at some specified level of maximum yield. For many agronomic crops, values of 90 to 95% maximum yield are frequently used. However, for vegetable crops, which have a higher market value and an economic optimum closer to maximum yield, values of 98% have been used (Figure 3.2). Sometimes researchers use discontinuous functions such as the "linear response and plateau" or "quadratic response and plateau" and define adequacy by the plateau line (Figure 3.3). Yet, other researchers have suggested that the correlation to final yield is less than ideal and have proposed the use of incremental growth-rate analysis in developing critical concentrations (45).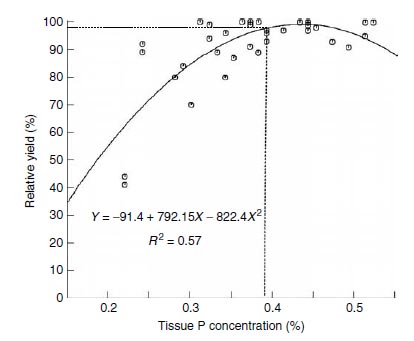 |
| FIGURE 3.2 Calculated critical phosphorus concentration in the midribs of endive at the eight-leaf stage using curvilinear model. (Adapted from C.A. Sanchez and H.W. Burdine, Soil Crop Sci. Soc. Fla. Proc. 48:37–40, 1989.) |
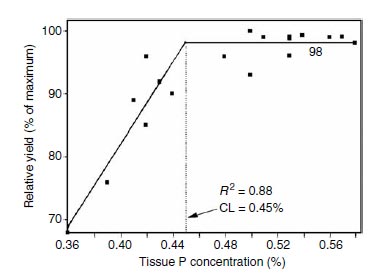 |
| FIGURE 3.3 Calculated critical phosphorus concentration (CL) of radish leaves using linear-response and plateau model. Plateau is at 98%. (Adapted from C.A. Sanchez et al., HortScience 26:30–32, 1991.) |
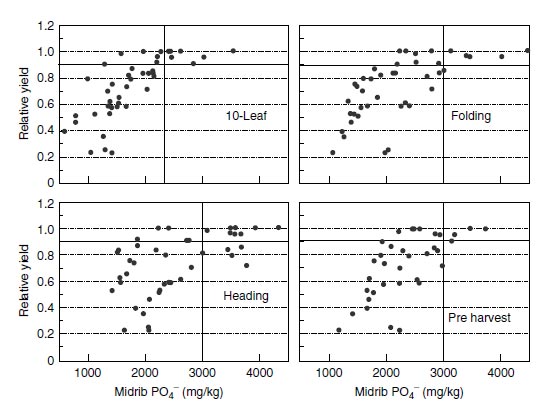 |
| FIGURE 3.4 Calculated critical acetic acid extractable phosphate-P concentrations at four growth stages for lettuce. (Gardner and Sanchez, unpublished data.) |
Levels of deficiency, sufficiency, and excess have been determined in solution culture and in greenhouse and field experiments. Total phosphorus content of a selected plant part at a certain growth stage is used for most crops. However, many standards developed for vegetable crops are based on a 2% acetic acid extraction (Figure 3.4). Diagnostic standards for various plant species are summarized in Table 3.1. This compilation includes data from other compilations and from research studies. When data from other compilations were used, priority was given to research that cited original source of data (46–48) so that potential users can scrutinize how the values were determined. However, when no other values were available, some values were drawn from sources that did not cite original research (49). Generally, crops require a preplant application of phosphorus fertilizer in the case of annual crops or before the fruiting cycle begins in the case of perennial crops. Diagnosis of a phosphorus deficiency by tissue analysis for annual crops is often postmortem for the existing crop.
TABLE 3.1
Diagnostic Ranges for Phosphorus Concentrations in Crop and Ornamental PlantsClick to view the table and zoom (image approx. 1MB)
OR
Click to Download to view clear table image offline (zip file approx. 2.05 MB)
Support our developers


