Spinning Disc Confocal Microscopy of Living Cells
I. INTRODUCTIONConfocal laser-scanning microscopy (CLSM) has in the last decade significantly extended our ability to visualise highly complex biological samples as multidimensional datasets (with dimensions of space and time, and different pseudocolours representing monochrome images collected from different fluorophores emitting at different wavelengths). In parallel, the introduction of fluorescent proteins such as green fluorescent protein (GFP) and its variants, as tags for structures of interest, has opened up new ways to observe intracellular processes in vivo. This article presents and discusses a variant of confocal microscopy, the spinning disc microscope, which is particularly well suited for fast three-dimensional (3D) real-time imaging of living cells, and describes its application to the imaging of yeast cells.
The most common type of confocal microscope uses a single focused laser beam to sequentially point scan a region of a sample. Spinning disc confocal microscopes (SDCMs) instead use a parallelised scanning approach with multiple confocal beams that simultaneously illuminate the sample. This overcomes the severe speed disadvantage that is inherent in the approach of sequentially scanning with a single beam. SDCM has thus become a powerful tool, especially for the time-limited requirements of in vivo imaging in combination with GFP technology.
A spinning disc confocal microscope consists of the confocal scanning unit containing the light source (a laser or fluorescence lamp), a rotating Nipkow disc with thousands of pinholes arranged in a geometric spiral, and a CCD camera, all of which are attached to a conventional light microscope (Fig. 1A). The light passes through the pinholes and then, when focused into the specimen by the objective lens, creates a set of confocal minibeams that sweep the chosen focal plane of the specimen as the disc rotates. The pinholes all have an identical, fixed aperture, and, in most commonly used setups, the excitation and emission light of each minibeam passes through the same pinhole (Inoué and Inoué, 2002; Kino, 1995). Because the pinholes only cover a small percentage of the disc surface, most of the excitation light would normally not pass the disc to reach the sample. This has for a long time been a limitation in the applicability of SDCM for weak fluorescence signals. However, Yokogawa Corp. overcame this problem by attaching a second disc on top of the pinhole disc that contains an identical array of microlenses, each of which covers a pinhole on the lower disc (Fig. 1A). Because each microlens focuses the excitation light of a larger region into its corresponding pinhole, this increases the efficiency of use of the excitation light from 1-4% (pinhole area) to 40-60% (Inoué and Inoué, 2002). This results in higher fluorescence emission signals due to the significant increase in excitation.
The fluorescence emission passes the pinholes and is then deflected onto the camera by a dichroic beam splitter, which is situated inbetween the two discs (Fig. 1A). Furthermore, because the unused excitation light is rejected already by the microlens disc, it cannot interfere with the detection signal, as would be the case in single disc designs.
In the Yokogawa scan unit, approximately 1000 of the 20,000 pinholes in the Nipkow disc cover the field of view of the microscope at any one time (Fig. 1B). The pinholes are arranged such that every region of the image is covered during one-twelfth of a disc rotation. Because the disc rotates at 1800rpm, 360 full frames are scanned per second. This fast image acquisition rate means that two features of the CCD camera used for image detection become limiting: the sensitivity of the camera and its readout time.
Two alternative spinning disc designs use xenon or mercury arc lamps instead of laser light for excitation (ATTO Bioscience, Olympus). They can be added onto existing wide-field microscope systems and can be switched easily between wide-field and confocal imaging modes. Because they use lamps with a continuous emission spectrum, the excitation light can be controlled and varied with excitation filters. This flexibility is not available with systems employing lasers because there the excitation is limited to lines provided by the installed lasers.
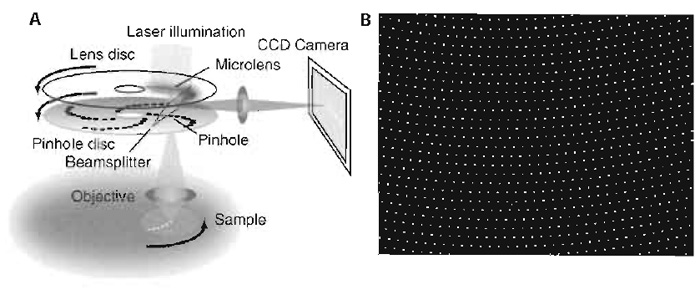 |
| FIGURE 1 (A) Schematic of an SDCM setup. (B) Approximately 1000 of the 20,000 pinholes on the Nipkow disc cover the field of view of the microscope at any one time. |
II. MATERIALS AND INSTRUMENTATION
A. Materials
1. Media
All cell culture media are prepared in bulk and sterilised by autoclaving at 10psi for 20rain. At this pressure, very little caramelisation of glucose takes place, which can cause background fluorescence. However, for live imaging we alternatively use sterile filtered medium to keep background fluorescence to an absolute minimum. The media is stored in 500-ml bottles, and agar is remelted in a microwave oven before using.
Yeast extract (YE): 0.5% (w/v) yeast extract (Bio 101 Systems-Q Biogene, 4018-022); 3.0% (w/v) glucose (Merck, 104074.1000)
Yeast extract + supplements (YES): YE plus 225mg/l each of adenine, histidine, leucine, uracil, and lysine hydrochloride (all Sigma, A 9126, H 8125, 61820, U 0750, L 5626).
Edinburgh minimal medium (EMM 2): 3g/liter potassium hydrogen phthallate (14.7mM) (Sigma, P 3792); 2.2 g/liter Na2HPO4 (15.5 mM) (Merck, 106586.0500); 5 g/liter NH4Cl (93.5 mM) (Merck, 101145.1000); 2% (w/v) glucose (111mM) (Merck, 104074.1000); 20ml/liter salts (stock "salts ×50"); 1 ml/liter vitamins (stock "vitamins ×1000"); and 0.1 ml/liter minerals (stock "minerals ×10,000").
"Salts ×50": 52.5g/liter MgCl2·6H2O (0.26M) (Merck, 105833.1000); 0.735 mg/liter CaCl2·2H2O (4.99mM) (Merck, 102382.1000); 50 g/liter KCl (0.67M) (Merck, 104936.1000); and 2 g/liter Na2SO4 (14.1mM) (Merck, 106649.1000)
"Vitamins ×1000": 1 g/liter pantothenic acid (4.20 mM) (Sigma, P 2250); 10g/liter nicotinic acid (81.2mM) (Sigma, N 0761); 10g/liter inositol (55.5mM) (Sigma, P 7508); and 10mg/liter biotin (40.8µM) (Sigma, B 4639)
"Minerals ×1000": 5 g/liter boric acid (80.9 mM) (Merck, 100165.1000); 4g/liter MnSO4 (23.7mM) (Sigma, M 1144); 4 g/liter ZnSO4·7H2O (13.9mM) (Sigma, Z 0251); 2g/liter FeCl2·6H2O (7.40mM) (Sigma, F 2130); 0.4g/liter molybdic acid (2.47mM) (Sigma, M 1019); 1g/liter KI (6.02mM) (Sigma, P 5686); 0.4g/liter CuSO4·5H2O (1.60mM) (Merck, 1027900250); and 10g/liter citric acid (47.6mM) (Merck, 100244).
Minimal supplemented medium (used for vegetative growth): EMM2 plus 225mg/liter each of adenine, histidine, leucine, uracil, and lysine hydrochloride (all Sigma, A 9126, H 8125, 61820, U 0750, L 5626), as described earlier for YES
Solid media: add 2% Difco Bacto agar (BD, 214010) to the appropriate liquid media before autoclaving
These media, and the fission yeast growth conditions employed, are described online under http://www-rcf.usc.edu/Nforsburg/lab.html and in H. Gutz (1974) and Moreno et al. (1991).
2. Other Materials
Culture dishes (MatTec Corporation, P35G-1.5-10- C). Lectin BS-1 from Bandeiraea simplicifolia (Sigma, L- 2380). Flow chamber (EMBL custom made, can be ordered from EMBL workshop). Silicon paste (Baysilone-Paste 35 g, hochviskos, GE Bayer Silicones).
B. Instrumentation
Spinning Disc Setups
Yokogawa scanheads: Two confocal scanning unit (CSU) designs by Yokogawa Corp. are available in our laboratory. The CSU-10 (Inoué and Inoué, 2002) is incorporated into several commercially available spinning disc setups (Perkin Elmer, VisiTech/Solamere). In addition to the CSU-10, we now also use a CSU-21 unit with higher and variable disc rotation speeds and with switchable filter sets. In our experiments, we use two Perkin Elmer setups with Hamamatsu Orca-ER CCD cameras and a 488/568/647-nm argon krypton laser, or 488/568/647-nm argon krypton, 442 helium/cadmium, and 488/514-nm Argon lasers, respectively. For switching between fluorescence channels, we use filter wheels (Ultraview LCI system) or acousto-optical tunable filters (AOTFs, Ultraview RS system).
III. PROCEDURES
In principle, there are no SDCM-specific restrictions, with respect either to the cell type or organism used or to the preparation/mounting procedures applied. Whatever specimen is mountable on an epifluorescence microscope or a single beam laser-scanning confocal setup can also be imaged using an SDCM. Here we present the mounting methods used for live imaging of fission yeast cells that express tubulin or microtubule-associated proteins tagged with GFP, CFP, and YFP (Brunner and Nurse, 2000; Ding et al., 1998; Drummond and Cross, 2000; Busch et al., 2004) and we describe the way we usually approach the task. To a large extent this approach would also be applicable to live imaging of yeast with epifluorescence and single beam confocal microscope setups.
A. Mounting Cells
Fission yeast cells can be mounted in a variety of ways for live imaging. However, for 3D imaging of intracellular structures over extended periods of time, it is important that the cells are absolutely immobile. Special attention therefore has to be given to immobilising the cells such that movements that would otherwise be created by medium flow cannot displace the cells during the acquisition process.
1. Mounting Cells in Petri Dishes
This method of adhering yeast cells to a coverslip allows imaging over short and intermediate time periods in liquid medium. Dividing cells will often disconnect from the glass surface and move out of the focal plane.
Steps
- Use culture dishes with glass bottoms formed by 0.17-mm-thick microscope coverslips of 10mm diameter. Be aware that their use is restricted to inverted microscopes! Wipe the glass surface inside the dish with a "cotton-bud" stick soaked in 70% ethanol containing one drop of glacial acetic acid per milliliter to remove the oil coating that is present on most glass surfaces. Rinse with double distilled water and dry with a Kimwipe.
- Coat the cleaned glass surface by distributing 0.5µl of 2mg/ml lectin in H2O with a pipette tip and allow to air dry.
- Pipet 300µl of cell suspension onto the coated glass and allow 5-10min for cells to adhere to the lectin-treated glass surface.
- Remove the medium and any unattached cells with a pipette, wash with 2ml of fresh medium, and finally add 200 µl fresh medium for imaging.
2. Mounting Cells on Solid Medium
This method of embedding yeast cells in agar medium allows imaging over long time periods. Dividing cells will remain in the selected focal planes.
Steps
- Stick one or more layers of narrow adhesive tape along the long axis of two slides, near one of their edges. The thickness of the tape will define the thickness of the agar pad and thus the amount of nutrients available. We usually make pads of about 0.25mm thickness.
- Place the slides on a fiat surface to the left and the right of a third clean untreated, empty slide, leaving small gaps between the parallel slides (Fig. 2).
- Melt previously prepared agar medium in the microwave (open the lid of the container as it may explode) and apply a drop of the hot medium onto the middle of the central slide.
- Place a fourth slide perpendicular to the other three, centred on top of the agar drop, and push its ends down onto the flanking slides in the taped area (Fig. 2). Keep pressing for about 30s to allow cooling and repolymerisation of the agar.
- Carefully remove the top slide (slow sideward sliding helps) and then, with a scalpel, trim away the edges of the remaining agar pad to make it slightly smaller than the square coverslip that will be used subsequently to cover the preparation.
- Add a drop of yeast cell suspension onto the agar pad. Make sure that the cells are not too dense. Usually, the aim is to have isolated single cells distributed all over the agar surface, with clear areas between them.
- Let the preparation stand until the agar has absorbed the fluid medium. Place a coverslip on top of the agar (avoid trapping air bubbles) and seal between the edges of the coverslip and the slide with a preparation of melted VALAP (a 1:1:1 mixture of vaseline, lanolin, and paraffin wax). The duration of usage of such a preparation depends on the thickness of the agar pad and on the density of the cells.
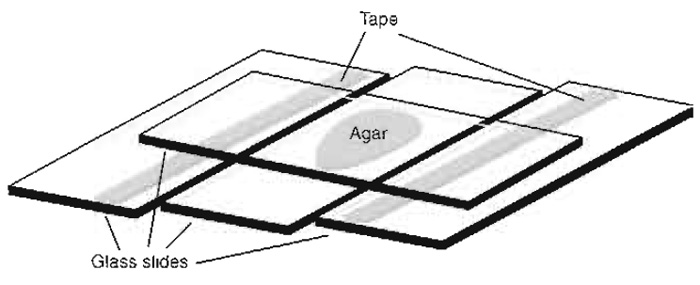 |
| FIGURE 2 Setup for making agar pads. |
3. Mounting Cells in a Flow Chamber
This method allows imaging of cells over short and intermediate time periods. It is particularly suitable for applications where media are exchanged during image acquisition (i.e., drug wash-in/wash-out experiments).
Steps
- The flow chamber (Fig. 3) consists of a closed cylindrical space (0.5 mm high) with connected inlet and outlet tubes for medium exchange, the ends of which, separated by 10mm, can be sealed by circular coverslips of 15mm diameter that form observation windows through which cells attached to the lower or upper coverslip can be observed using an inverted or upright microscope, respectively Prepare the flow chamber for adhesion of the coverslips by covering the edges that will support them with silicon paste.
- Clean two coverslips in 70% ethanol containing a drop or two of glacial acetic acid/ml as described previously. Rinse slides with water and dry with a Kimwipe.
- Coat one coverslip with lectin as described earlier and place it on the silicon paste to form a window on the lower surface of the flow chamber, with the lectin-coated side facing inward.
- Apply the cell suspension to the lectin-coated surface of the coverslip, let cells settle for 5min, remove the medium, and wash once with fresh medium.
- Immediately proceed to close the chamber by applying the second clean coverslip to form the upper window and flow in the required medium to fill the chamber and prevent the cells from drying out.
- Exchange the medium as desired during image acquisition using the attached syringe.
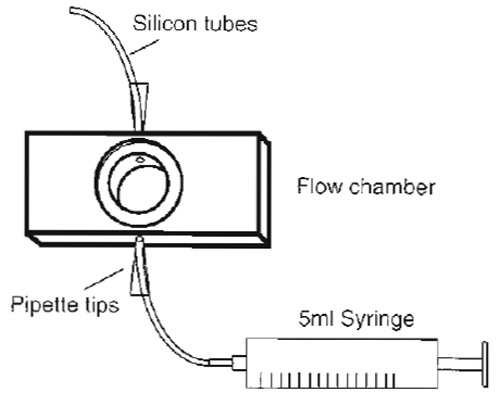 |
| FIGURE 3 Design of a simple flow chamber. The core made of aluminium has the size of a standard microscopy slide except that it is slightly thicker. However, multiple sizes are available to suit the experimental requirements. |
B. Imaging Procedure
Several requirements have to be carefully considered to optimally resolve a dynamic process of interest in space and time. Above all, the total amount of light required for imaging should be kept to a minimum because the strong illumination needed for fluorescence microscopy observation will invariably affect the living sample, particularly if of a wavelength below 500nm. The microscope setup should therefore be optimised to collect as much of the fluorescence signal as possible. Use high NA objectives and match the refractive indices of the sample and the objective. Also the selected camera type is important. The more sensitive it is, the less excitation light is required for a viable signal. What should also be considered in the choice of camera is that for imaging very fast events, its readout time can become a limiting factor.
After optimizing the microscope setup, the first challenge is to set the imaging parameters such that your structure of interest can be unambiguously detected with sufficient contrast for the duration of the experiment, during which the signal intensity will decrease over time due to photobleaching. The observation intervals and the total experiment duration will therefore influence the initial image acquisition settings. Setting up such in vivo experiments thus means finding an optimal compromise between these variables.
Four relevant imaging parameters can be manipulated on an SDCM. (1) The excitation intensity defines the amount of photons that reach the sample and excite the fluorophores. (2) The exposure time defines the amount of emission light being collected by the CCD camera prior to each image readout. (3) The degree of CCD binning defines how many photons are sampled into a single image point (pixel), and also the spatial resolution. (4) Finally, the camera gain setting defines the overall sensitivity of the camera. How changing these parameters affects the image acquisition is shown in Fig. 4A. Figure 4B illustrates the interdependence of the parameters for three-dimensional (x, y, and time) temporal imaging experiments. For example, if the amount of excitation light (n photons) to be used for the complete duration of the experiment is defined, an increase in the number of time points has to be compensated for by decreasing the amount of excitation per image, either by shortening each exposure time or by reducing the excitation intensity. This will be perceived as a lower signal (compare a and b). If the signal level cannot be reduced, an increase in the number of time points for an experiment will be brought about by an increase in total irradiation (compare a and c), with concomitant increases in photobleaching (not shown in Fig 4B) and phototoxicity. An alternative possibility, which is not demonstrable in the illustration, is to increase CCD binning, which allows one to keep the irradiation dose low, but results in a loss of spatial resolution and thus of structural information.
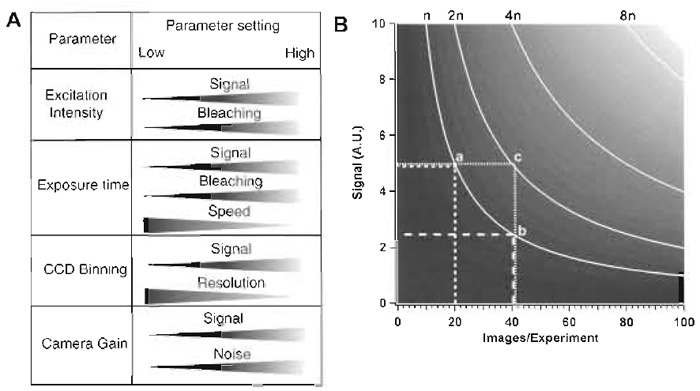 |
| FIGURE 4 (A) Variables that can be changed on an SDCM and effects of the respective changes on other parameters that are relevant for live imaging. (B) The diagram shows interdependence among the number of frames taken in an experiment (X axis), the signal intensity per image (a function of exposure time and excitation intensity; Y axis), and the number of photons exciting the sample (n curves). A.U., arbitrary units of signal intensity. |
The considerations we have discussed can be easily extended to four-dimensional (x, y, z, and time) temporal imaging, which is one of the strong points of SDCM. To collect a z stack of confocal x, y images spanning the relevant z-axis range of an object at each of several time points, three simple points have to be considered. (1) The range along the z axis should be set according to the thickness and expected movement of the structures of interest. (2) It should not cover nonrelevant regions. (3) The number of optical sections should be set according to the required z axis resolution and, to avoid unnecessary oversampling, should not be set smaller than half the z axis resolution of the confocal microscope itself. It is possible that ones initial ideal image acquisition settings have to be adjusted if the number of exposures required for the complete time series would otherwise result in unacceptable levels of photobleaching.
Steps for Setting up a SDCM in Vivo Experiment
- Plan all general settings (time intervals, duration, camera settings) for the experiment using existing comparable images and sequences before putting the sample on the microscope. This minimises setup and fine-tuning time.
- Use as little light as possible for finding the sample! Find the focal plane and, if possible, also your object of interest using phase contrast or DIC. This reduces unnecessary photobleaching prior to imaging. If you need to see the fluorescence to identify your object, first reduce the fluorescence excitation as much as possible.
- Optimise the settings for image acquisition on the chosen object as discussed earlier and illustrated in Fig. 4A.
- Once you find the optimal conditions, choose a new object. Set upper and lower z limits. With sufficient preexisting knowledge of the sample (e.g., the diameter of fission yeast cells is around 4µm), upper and lower z limits can be set by focusing on the middle of the sample and setting the z limits around it without further imaging (e.g.) ±2.2 µm for fission yeast cells).
- Always store all the raw image data before further processing the images.
C. Multicolor Imaging
SDCMs allow multicolor imaging from multiple fluorochromes. This is usually done by sequentially acquiring the appropriate fluorescence channel images. The switching between different detection settings can be done with filter wheels or (just for the excitation) with acousto-optical tunable filters. AOTFs are provided by the manufacturers of some of the new spinning disc setups (Perkin Elmer, VisiTec/Solamere). Sequential "multichannel" image acquisition at multiple wavelengths involves a significant reduction in the frame rate (at least by a factor of two) because at least two wavelength-specific images have to be acquired for every time point. This can be a limitation when observing very fast processes. Furthermore, fast structures might move during the time intervals between acquisition of the different wavelength images, leading to spatial mismatches between the different image channels. If this is the case, an alternative parallel acquisition approach, where the image channels are detected simultaneously, has to be implemented. For this, the emitted fluorescence is split into longer and shorter wavelength components by an appropriate dichroic beam splitter and is projected either onto separate CCD cameras or onto different regions of the same CCD chip. The recent introduction of sensitive color CCD cameras (such as the Orca 3CCD camera by Hamamatsu Photonics) increases the potential for fast multichannel imaging (T. Nagai, personal communication).
IV. COMMENTS
In imaging, as in all experiments, the tools should match the task. It is therefore important to understand the specific properties and advantages of the available imaging approaches. The following discussions highlight the abilities and shortcomings of SDCM versus single beam confocal and wide-field microscopes.
A. SDCM versus Single Beam Scanning Confocal Microscopy (see Table I)
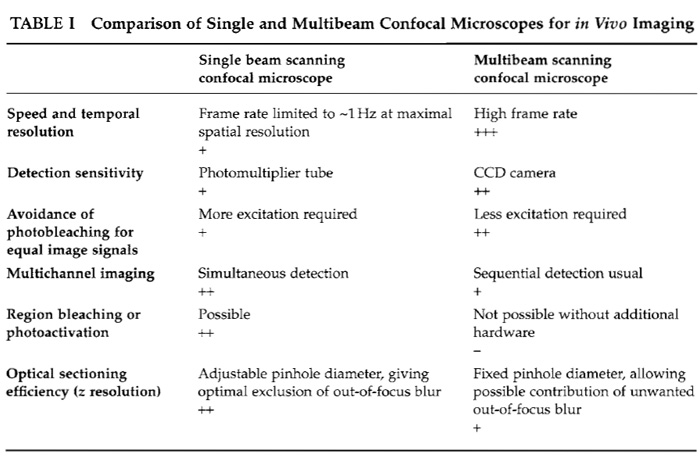 |
1. Sensitivity
An essential point to be taken into consideration is the sensitivity of the detection devices. These are CCD cameras for SDCMs and PMTs for single beam confocal microscopes. CCD cameras have higher intrinsic quantum efficiencies than PMTs and therefore collect the available emission photons more efficiently, resulting in increased sensitivity (Inoué and Inoué, 2002). In practice, this significantly reduces the required exposure times in SDCM experiments, permitting higher frame rates and accordingly a speed advantage for equivalent signals when compared to single beam systems. This makes SDCM more suitable for imaging fast phenomena, although both types of confocal microscope are equally suited for time-lapse applications, where observations may be extended over several hours, with significant pauses between the acquisition of each 2D (x, y) image or each 3D (x, y, z) image stack.
2. Imaging Speed
SDCMs are particularly well suited for fast 3D (x, y, and time) and 4D (x, y, z, and time) temporal imaging. This is due to the almost instantaneous image generation by the spinning disc and the very sensitive CCD cameras that can be used. The frame acquisition rate is determined by the exposure time required by the CCD camera. With sensitive cameras this can be lowered considerably. In this way, the high frame rates required for resolving fast events can be achieved. Generally, an image of equal quality and resolution can be generated significantly faster on an SDCM than on a single beam scanning confocal microscope. The speed disadvantage of single beam systems can, however, be partially overcome by scanning only a small subregion of the total image field. Furthermore, if only a single line is read out [e.g., acquisition of a 2D (x and time) image, suitable for certain types of Ca2+ imaging], the scan rate of a single beam confocal microscope can significantly exceed the frame rate of an SDCM.
3. Photobleaching and Phototoxicity
An observation made by many researchers working with both single beam and multibeam confocal systems is that photobleaching seems to be reduced in multibeam systems, permitting the same kind of sample to be observed over a longer period of time. However, it has been shown that the absolute rate of bleaching in SDCMs is similar to that using other confocal microscopes (Inoué and Inoué, 2002). The difference seems to be mainly due to the increased sensitivity of detection, which allows less excitation light to be used in SDCM.
4. Optical Sectioning
Adjusting the diameter of the detection pinhole varies the thickness of an optical section in a single beam confocal microscope, and hence z resolution. This is not possible with an SDCM. Here, the pinhole diameter is fixed because the holes in the disc cannot be modified. The numerical aperture of the objective employed therefore defines the thickness of the optical section. With high NA objectives (>1.3), this is in the range of <1µm at 488nm excitation. Furthermore, when imaging within thick specimens, out-of-focus fluorescence from an excitation minibeam can reach into neighbouring pinholes, which will compromise confocality (Inoué and Inoué, 2002). For such specimens, the optical sectioning will therefore be better if a single beam confocal microscope is used. For dynamic in vivo applications, however, these sectioning considerations are usually outweighed by the superior acquisition performance of multibeam systems.
B. SDCM versus Wide-Field Microscopy
Almost all of the mentioned positive features of SDCM (speed, sensitivity) also apply to wide-field microscope setups, which in principle are even faster due to the fact that the entire field of view is illuminated simultaneously. In addition, wide-field systems collect more of the emission light than SDCMs (since no emitted light is rejected by the disc of confocal pinholes), which is important for extremely weak fluorescence signals. However, due to the lack of confocality, deconvolution has to be applied to images generated on wide-field systems in order to gain a reasonable 3D resolution. Deconvolution is time-consuming and is not trivial, as it critically depends on optimised system setups and image acquisition parameters in order to avoid the creation of artefacts, as well as requiring careful measurement of the point spread function of the microscope.
Furthermore, a z stack of wide-field images has to be acquired to enable deconvolution to be applied, and motion artefacts can be created in such a z stack when imaging fast processes. This is not the case for SDCM, as a single unprocessed image already constitutes a reasonably blur-free optical section. This means that SDCM has a significant speed and sample illumination advantage over a conventional wide-field microscope for fast temporal imaging of a single focal plane.
It should be noted that deconvolution can also be applied to z stacks acquired by SDCM, which can further increase the z resolution.
V. PITFALLS
Although most SDCMs use laser light for excitation, the laser cannot be used for spot or region bleaching as in single beam confocal microscopes. Powerful applications such as fluorescence recovery after photobleaching, photoconversion, or photoactivation, which are used to analyze protein dynamics in living cells, are therefore not possible. However, regional bleaching could, in principle, be made possible by implementing an additional positionable laser.
References
Brunner, D., and Nurse, R (2000). CLIP170-1ike eiplp spatially organizes microtubular dynamics in fission yeast. Cell 102, 695-704.
Busch, K. E., Hayles, J., Nurse, R, and Brunner, D. (2004). Tea2p Kinesin is involved in spatial microtubule organization by transporting tiplp on microeubules. Dev. Cell 6, 831-843.
Ding, D.-Q., Chikashige, Y., Haraguchi, T., and Hiraoka, Y. (1998). Oscillatory nuclear movement in fission yeast meiotic prophase is driven by astral microeubules as revealed by continuous observation of chromosomes and microeubules in living cells. J. Cell Sci. 111, 701-712.
Drummond, D. R., and Cross, R. A. (2000). Dynamics of interphase microtubules in Schizosaccharomyces pombe. Curr. Biol. 10, 766- 775.
Gutz, H. H., Leupold, U., and Loprieno, N. (1974). Schizosaccharomyces pombe. In "Handbook of Genetics" (R. C. King, ed.), pp. 395-445. Plenum Press, New York.
Inoué, S., and Inou6, T. (2002). Direct-view high-speed confocal scanner: The CSU-10. Methods Cell Biol. 70, 87-127.
Kino, G. S. (1995). Intermediate optics in Nipkow disc microscopes. In "Handbook of Biological Confocal Microscopy" (J. B. Pawley, ed.), pp. 155-165. Plenum Press, New York.
Moreno, S., Klar, A., and Nurse, P. (1991). Molecular genetic analysis of fission yeast Schizosaccharomyces pombe. Methods Enzymol. 194, 795-823.
Support our developers


