Measurements of Endosomal pH in Live Cells by Dual-Excitation Fluorescence Imaging
I. INTRODUCTIONThe pH of endosomes can be measured with minimal interference to cellular function using internalized ligands or antibodies labeled with pHsensitive fluorescent probes. Following internalization of receptor-bound or fluid phase probes, a rapid acidification can be detected along the endosomal pathway, with the pH decreasing within minutes by nearly one pH unit (Fig. 1). Cargo can then recycle back to the plasma membrane, reach the Trans-Golgi- Network (TGN) (pH~6.0), or be targeted for degradation through late endosomes (pH < 6.0) and lysosomes (pH < 5.5). Determination of the vesicular pH thus allows one to establish whether, at a specific time point, the cargo resides within a sorting, recycling, or degradation compartment (Demaurex, 2002). Repeating such pH measurements at different times during the internalization provides a functional readout of the pathway followed by internalized compounds.
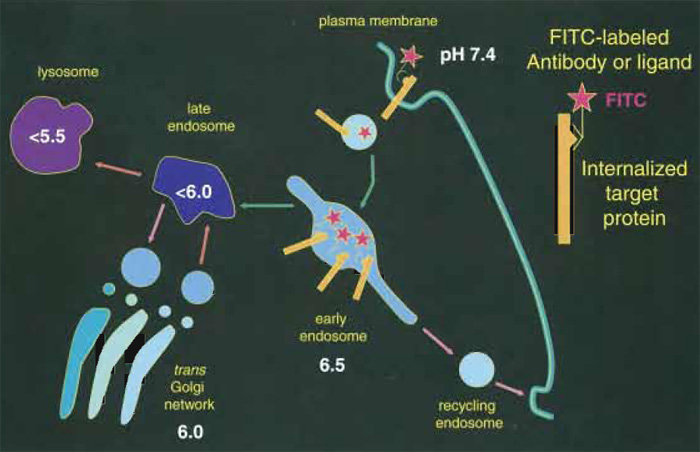 |
| FIGURE 1 Measuring the pH of endocytic organelles with internalized FITC. Organelles acidify rapidly as they progress along the endocytic pathway. The pH of endocytic compartments can be measured simply by allowing cells to internalize FITC-labeled antibodies or ligands (red stars). The fluorescence of the FITClabeled compartments is then imaged at the pH-dependent (λex = 490nm) and pH-independent (λex = 440nm) FITC excitation wavelength to determine the pH of the organelle. |
The most convenient indicator for such measurements is Fluorescein Isothiocyanate (FITC), and numerous specific antibodies and ligands labeled with FITC are readily available. Covalent labeling of specific proteins or antibodies with FITC is relatively easy to perform, at low cost (Grinstein and Furuya, 1988). From a measurement standpoint, the most important feature is that the bright fluorescence of FITC is strongly pH dependent at its peak excitation wavelength of λex = 490nm, but is almost completely pH insensitive at λex = 440nm, thus allowing dualexcitation ratio fluorescence imaging. The ratio λex = 490/λex- 440 normalizes the measurements for the amount of fluorophore, as well as for differences in refractive index and changes in focus, and truly represents pH. The fluorescence ratio can be calibrated in situ by equilibrating the pH of the vesicle with the extracellular pH using nigericin, a K+/H+ ionophore, and monensin, a Na+/H+ ionophore (for details, see Thomas et al. (1979)). Using a standard fluorescence microscopy apparatus, such as the one described in Fig. 2 and the protocol and image analysis techniques described here, the pH of endocytic compartments can be measured simply by incubating cells with FITClabeled ligands or antibodies (Demaurex et al., 1998; Gagescu et al., 2000; Piguet et al., 1999, 2000).
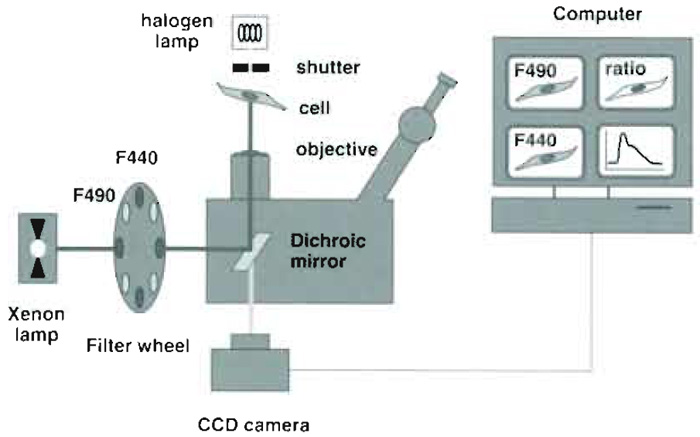 |
| FIGURE 2 Optical and hardware components used for endosomal pH measurements. The key components
are (1) an objective with high (1.4) numerical aperture (2) high-quality filters and dichroic mirrors, and (3) a fast, low-noise, highly sensitive CCD camera. The camera is attached at the bottom port of the microscope to maximize light collection. High-quality optics and a sensitive camera are required to capture the faint fluorescence of small moving endosomes with sufficient signal to noise. |
II. MATERIALS AND INSTRUMENTATION
MES, HEPES, and RPMI 1640 medium (bicarbonate free) are obtained from Sigma. Ionophores (sodium salts) are from Fluka (nigericin, Cat. No. 72445; monensin Cat. No. 69864).
The open perfusion microincubator, Leiden coverslip holder, and temperature controller are from Harvard Apparatus (refs. PDMI-2 and TC-202A). Glass coverslips are "Assistent" circular cover glasses No. 1001, Ø 25mm, thickness 0.16mm from Karl Hecht Glaswarenfabrik, D-97647 Sondheim/Rhön, Germany.
The setup for ratio fluorescence imaging is illustrated in Fig. 1. We use a Axiovert S100TV microscope and a 100X, 1.3 NA oil-immersion objective (Carl Zeiss AG, Feldbach, Switzerland). Alternate excitation at 440 ± 10 and 490 ± 10nm is achieved using a fast monochromator (Deltaram, Photon Technology International Inc., Monmouth Junction, NJ) or a filter wheel equipped with excitation filters 440DF20 (Cat. No. XF1010) and 490DF20 (Cat. No. XF1011, both from Omega Optical, Brattleboro, VT). The light path comprises a 515DRLPXR dichroic mirror (Cat. No. XF 2058) and 535DF25 emission filter (Cat. No. XF3001) inserted into the microscope filter slider. Images are captured with a back-illuminated CCD frame transfer camera (MicroMax 512 BFT; Roper Scientific; Trenton, NJ) attached to the bottom port of the microscope.
III. PROCEDURES
A. Preparation
Solutions
- Recording solution: 140mM NaCl, 5 mM KCl, 1 mM MgCl2, 1mM CaCl2, 10 mM glucose, 20 mM HEPES, pH 7.4, with NaOH. To make 100ml, add 14ml NaCl 1M, 0.5 ml KCl 1M, 0.1 ml MgCl2 1M, 0.1 ml CaCl2 1M, 0.5 ml 40% glucose, 2ml HEPES 1M, and complete to 100ml with distilled water.
- Calibration solution: 140mM KCl, 1 mM MgCl2, 0.2mM EGTA, 20mM HEPES (pH 7.0-8.0) or MES (pH 5.5-6.5), 5µg/ml nigericin, 5µM monensin. To make 50ml of each, add 28 ml KCl 1M, 4ml MES 1M, 200µl MgCI2 1M, 200µl EGTA 0.4M, and complete to 200ml with distilled water. Divide in 50-ml aliquots labeled "5.5," "6.0," and "6.5." Repeat the same procedure using HEPES instead of MES as buffer and divide in 50-ml aliquots labeled "7.0," "7.5," and "8.0." Adjust the pH to 5.5, 6.0, 6.5, 7.0, 7.5, and 8.0 with KOH or HCl using a pH electrode precalibrated at 37°C under continuous magnetic stirring. These solutions can be kept at 4°C for 1-2 weeks. On the day of the experiment, take 10ml of each calibration solution and add 10µl nigericin (stock 5mg/ml) and 1µl monensin (stock 50mM) to each vial. Measure the pH precisely with the pH electrode (at 37°C) and write down the pH value to two decimals (e.g., pH 5.54; 5.92; 6.02; 6.54; 7.04). These solutions must be used the same day.
- Nigericin stock: Add 1 ml ethanol 100% to 5mg nigericin and store at -20°C for no more than 3 months.
- Monensin stock: Add 1.44ml ethanol 100% to 50mg monensin and store at -20°C for no more than 3 months.
Steps
- In a hood, wash the coverslips separately with ethanol and rinse with distilled water. Place coverslips into a tank filled with distilled water. Autoclave. Clean coverslips can be stored in sterile water for 1-2 months.
- If necessary, coat the coverslips with an agent that promotes attachment of weakly adherent cells. Poly-L-lysine and Cell Tak (collaborative Research Inc) have been used extensively. Wash excess adhesive agent.
- Place each coverslip into a 35-mm petri culture dish (single or multiwell). Close the lid and leave for 20min under UV illumination. The culture dishes "loaded" with clean coverslips can be used for 1-2 weeks.
- Two to 3 days prior to the measurements, plate cells on the glass coverslip at low density (~104 cells). Fill the petri dish with 3 ml of culture medium.
- Optional: One to 2 days before measurements, transfect cells with the receptor or recombinant protein bearing the cognate epitope for the FITC-labeled ligand or antibody.
B. Loading Cells with the FITC.Labeled Ligand or Antibody
The example given here is for endosomal pH measurements with internalized FITC-transferrin. Optimal concentrations, requirement for serum depletion, and incubation times have to be determined for each particular ligand or antibody.
Steps
- Incubate cells in their appropriate culture medium with 25µg/ml of FITC-labeled ligand for 20min at 37°C.
- Wash the cells twice with phosphate-buffered saline (PBS) to remove extracellular FITC. Maintain cells in recording medium until use. Measurements should be performed within 30min of loading.
- If necessary, wash the cells twice with acidic solution (pH 4.0) at 4°C to remove FITC bound to the plasma membrane.
- Using fine tweezers, place the coverslip into the Leiden chamber, orienting the coverslip so that cells face upward. Ensure that a good seal exists between the coverslip and the O ring by wiping away excess medium from the underside of the coverslip and checking for leaks. The underside should remain dry and clean to allow oil-immersion microscopy.
- Add 2ml of recording solution to the dish and proceed to the experiment.
C. Measurements of FITC Fluorescence Ratio
- Place a drop of oil on the immersion objective and position the loaded Leiden dish in an open perfusion microincubator over the objective.
- Turn off room lights or use a dark curtain around the microscope to eliminate stray light from entering the optical system. Red light can be used for dim illumination of the room if a red-blocking filter (550CFSP-Omega Optical) is mounted in front of the camera.
- Turn on the lamp power supply and then start the arc lamp. It is important to start the lamp before turning the computer on to eliminate possible damage due to power surges.
- Turn on the computer and other external hardware devices. Verify that the temperature controller of the microincubator is set to the appropriate value (e.g., 37°C).
- Launch the software designed for time-lapse ratio fluorescence measurements and initiate a new experiment. We use Metafluor 5.0 from Universal Imaging Corp. Using the illumination control panel, install the correct hardware drivers for the external devices, and configure them with the appropriate settings. Through the use of "Metadevices," Metafluor allows the user to create a variety of hardware configurations with different names.
- In the "configure acquisition" window set the experiment-specific parameters such as exposure time, pixel binning, and Metadevice selection for each wavelength. Typical exposure times range from 0.5 to l s and should not exceed 2 s (see Section V). Keep in mind that wavelength 1 is always the numerator of ratio 1. After configuring these settings, save them as a protocol file that can be retrieved for subsequent use.
- In the "configure experiment" menu, choose the wavelengths to acquire (W1 and W2) and ratio to be calculated (W1 over W2). Make sure that the acquired images and calculated ratio are displayed and updated continuously.
- Observe the sample using transmission light to bring the cells in focus and then switch to fluorescence illumination to select cells that express the internalized probe correctly. Open the camera port and acquire a set of images. If necessary, reset the "configure acquisition" parameters to optimize the exposure times.
- In the "reference image" menu, acquire a set of images with the illumination shutter closed to subtract the background noise of the camera. Then reopen the shutter and acquire updated images with background subtraction.
- Use the "region" tool to define regions of interest around individual cells. For each region, spatially averaged fluorescence and ratio data will be graphed only for pixels with absolute values higher than the preset threshold. Once the regions are defined, return to the image windows and set the threshold levels to separate the labeled structures from the background fluorescence.
- From the "experiment control panel," select "save image" to save the fluorescence images. Always save the original fluorescence images during acquisition, not the calculated ratios.
- Open the "event mark" window to define and reuse markers associated with a specific experiment. Markers applied during drug addition and calibration facilitate the analysis of the experiment during playback.
- Acquire a series of fluorescence images from several individual cells (~50) to obtain the steady-state ratio value of the labeled organelle. Do not perform more than two to three image acquisitions per field to avoid bleaching of FITC. Check on the ratio graph that the spatially averaged ratio values are homogeneous between cells.
D. Calibration of pH vs Fluorescence
- At the end of the acquisition period, select one representative field and perfuse the dish sequentially with the calibration solutions. Monitor the fluorescence to ensure establishment of a stable ratio, indicating equilibration of the vesicular pH with the external pH.
- Once a steady-state ratio has been collected, change to the next solution and repeat step 1. Continue until fluorescence ratios have been recorded for all the calibration solutions.
- Using the Metamorph software, create a titration calibration table to convert fluorescence ratio values to pH. The calibration table can be used to plot real-time pH change and to create a pH "map" of the labeled structures.
E. Image Analysis: Determining the pH of Individual Endosomes
Preparation
Using Metamorph, create the following analysis "Journals," "table," and "state file":
1. Journal "Initialize Ratio.jnl"
| Line | Function | Value | Description |
| 1 | Load gray calibration table | File: 256.GRY | Load predefined calibration table |
| 2 | Apply gray calibration table | Rescale the 8-bit ratio image from 256 digits into ratio units | |
| 3 | Threshold image | Image: current at start Threshold: 1; 255; inclusive | Select labeled structures on the ratio image |
| 4 | Integrated morphometry-load state | File: Ratio.IMA | Load predefined object selection and measurement criteria |
2. Calibration Table "256.GRY"
Image depth: 8 bit; gray vs calibration values: 0 → 0.5; 256 → 3.5; interpolation: linear
3. State file "Ratio.IMA"
Setup parameters for classifying: Enable: pixel area:
10 ≤ N ≤ 500; hole area: 0 ≤ N ≤ 0
Setup parameters for measuring: Enable: area; average gray value; format: #.###
Configure log: Enable: image name; image plane; object #; average gray value; area
Preferences: Measure objects: Disable: "warn user when measurements data will be erased"
4. Journal "Measure ratio.Jnl"
| Line | Function | Value | Description |
| 1 | Integrated morphometry-measure |
Image: current at start Plane: current | Measure all thresholded objects meeting criteria on |
| 2 | Integrated morphometry-log data |
Image: current at start | Log measurement data to spreadsheet |
Steps
- Using the MetaFluor program, open a previous experiment and create a series of ratio images. In the "Image display controls," check that the minimal and maximal ratio values are set to 0.5 and 3.5, respectively. Adjust the threshold on the 440-nm image (W2) to separate the fluorescent vesicles from the background. If possible, the same threshold should be used for all images. From the "experiment control panel," select "save ratios" to save the ratio images as 8-bit TIF images. Make sure to save only one ratio image for each field acquired during the steady-state measurement period.
- Launch the MetaMorph program. In the "File" menu, use the function "Build stack: numbered name" to load a stack of ratio image from the desired experiment. Use the "Stack: Montage" function to create and print an image gallery. Check for duplicates.
- In the "Journal" menu, use the function "Run" with journal "Initialize Ratio.jnl" to rescale the 8-bit ratio image and load the object selection and measurement criteria. Tip: Journal playback can be simplifled by defining journals as button on the "Journal Taskbar."
- In the "Log" menu, use the function "Open object log" to create the connection with the spreadsheet program (e.g., Microsoft Excel).
- In the "Journal" menu, use the function "Loop for all planes," with journal "Measure ratio.Jnl." This will extract the average ratio value of all objects that meet the criteria (area size between 10 and 500 pixels, devoid of holes) in every image from the ratio stack. Check the quality of the segmentation by comparing the measurement images with the original fluorescence images. Most individual vesicles should be included as well as aggregates of <10 vesicles. Spots and very large compound structures should not be included (Fig. 3).
- Switch to the spreadsheet program. Check the quality of the measurements by displaying ratio data as a histogram. The distribution should be gaussian if the population of vesicles has a homogeneous pH.
- Using the spreadsheet program, create a calibration curve for the experiment. Enter the ratio values measured during the calibration procedure as X column and the pH values of the calibration solutions (measured at two decimals) as Y column. Display the resulting points on a dot graph. Fit a linear equation to the points and copy the parameters. Use these values to apply a calibration equation to ratio data. A pH histogram can now be generated and the average pH values of the population of vesicles determined.
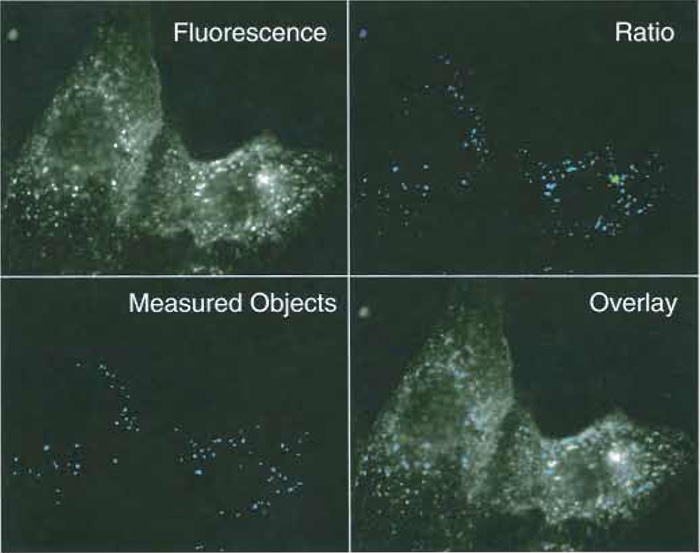 |
| FIGURE 3 Fluorescence and ratio images of early endosomes in MDCK cells. MCDK cells were allowed to internalize FITC-labeled transferrin for 5 min at 37°C. (Top left) A 490-nm fluorescence image, exposure time 1 s. (Top right) A 490/440-nm ratio image. A low-intensity threshold of 30/4095 was used to separate fluorescent vesicles from background. (Bottom left) Vesicles recognized as individual endosomes by the image analysis routine. Seventy-three individual objects met selection criteria (pixel area 10-500, no holes). (Bottom right) Composite image of the vesicles selected by the image analysis routine and the original fluorescence image. |
IV. COMMENTS
Even for experienced users, a few minutes are required to collect enough images of FITC-labeled cells to construct a pH histogram. Within the acquisitioln period, the pH of endosomes can change significantly, particularly during the early phases of endocytosis. For this reason, it is important to check that the pH is at steady state by graphing the ratio values during the acquisition period. In any case, the acquisition period should be kept as short as possible and should not exceed 20 min.
When counting individual vesicles, small and large structures have the same "weight" in the pH histogram. This biases the readout toward the pH value of the smallest, most numerous vesicles. If the vesicles are highly heterogeneous in size, the pH values should be normalized to the vesicle area.
Failure to wash carefully extracellular FITC might result in a large contribution of the plasma membrane to the ratio images. These structures are normally excluded by the size criteria, but will otherwise appear as a second peak around pH 7.4 on the histogram.
V. PITFALLS
- Do not use exposure times longer than 2s to avoid distortions caused by the movement of endosomes. The division of two fluorescence images acquired sequentially will invariably produce "hot" or "cool" pixels on the ratio images, mainly at the organelle edges. Most irrelevant pixels are removed by the intensity threshold, but this procedure discards many small moving vesicles, resulting in a significant loss of information. Using short exposures is the best way to capture the rapidly moving endosomes and to avoid such distortions. The gain in resolution allows to better quantify the ratio images so that a fast, sensitive camera is highly desirable to obtain accurate pH data.
- Use minimal illumination to prevent photobleaching and cellular damage. Do not make repeated measurements of the same field, but instead perform separate measurements on different fields. The best procedure is to select the cells at random, using brightfield illumination. If only a few cells are labeled with the FITC ligand, the labeled cells should be selected using 440-nm illumination to avoid selection bias induced by the pH dependency of FITC-a bright 490nm fluorescence reflecting not only a successful labeling, but also an elevated pH.
References
Demaurex, N. (2002). pH Homeostasis of cellular organelles. News Physiol Sci. 17, 1-5.
Demaurex, N., Furuya, W., D'Souza, S., Bonifacino, J. S., and Grinstein, S. (1998). Mechanism of acidification of the trans-Golgi network (TGN): In situ measurements of pH using retrieval of TGN38 and furin from the cell surface. J. Biol. Chem. 273(4), 2044-2051.
Gagescu, R., Demaurex, N., Parton, R. G., Hunziker, W., Huber, L. A., and Gruenberg, J. (2000). The recycling endosome of Madin-Darby canine kidney cells is a mildly acidic compartment rich in raft components. Mol. Biol. Cell. 11(8), 2775-2791.
Grinstein, S., and Furuya, W. (1988). Assessment of Na+-H+ exchange activity in phagosomal membranes of human neutrophils. Am. J. Physiol. 254(2 Pt 1), C272-C285.
Piguet, V., Gu, F., Foti, M., Demaurex, N., Gruenberg, J., Carpentier, J. L., and Trono, D. (1999). Nef-induced CD4 degradation: A diacidic-based motif in Nef functions as a lysosomal targeting signal through the binding of beta-COP in endosomes. Cell 97(1), 63-73.
Piguet, V., Wan, L., Borel, C., Mangasarian, A., Demaurex, N., Thomas, G., and Trono, D. (2000). HIV-1 Nef protein binds to the cellular protein PACS-1 to downregulate class I major histocompatibility complexes. Nature Cell Biol. 2(3), 163-167.
Thomas, J. A., Buchsbaum, R. N., Zimniak, A., and Racker, E. (1979). Intracellular pH measurements in Ehrlich ascites tumor cells utilizing spectroscopic probes generated in situ. Biochemistry 18(11), 2210-2218.
Support our developers


