Technique for detecting repetitive DNA
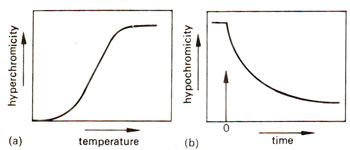
Fig. 28.2. Hyperchromicity and hypochromicity'of DNA due to denaturation and reassociation respectively.
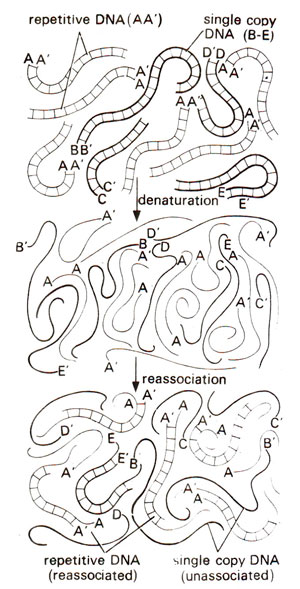
Fig. 28.3. Denaturation and reassociation of DNA containing six copies of repetitive DNA (AA;) shown by thin lines and one copy each of four different unique or single copy DNA's (B-B'; C-C’; D-D; E-E') shown by thick lines. Note that more repetitive DNA has reassociated than the single copy DNA. This principle is used for determining the proportion of repetitive DNA in a genome (redrawn from Sci. Amer. 222: April, 1970).
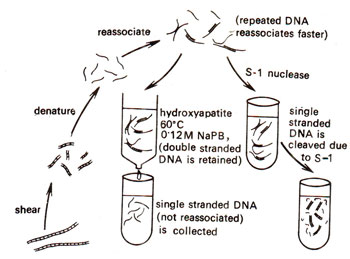
Fig. 28.4. Technique used for measuring the extent of reassociation by separating reassociated double stranded DNA from remaining single stranded DNA. Mixture of double stranded and single stranded DNAs is passed through a column of hydroxyapatite crystals, which retains the double stranded DNA, and allows single stranded DNA to pass through. Double stranded DNA can be eluted by raising temperature and its quantity measured (redrawn from Sci. Amer. 222, April, 1970).
Fig. 28.2. Hyperchromicity and hypochromicity'of DNA due to denaturation and reassociation respectively.
Fig. 28.4. Technique used for measuring the extent of reassociation by separating reassociated double stranded DNA from remaining single stranded DNA. Mixture of double stranded and single stranded DNAs is passed through a column of hydroxyapatite crystals, which retains the double stranded DNA, and allows single stranded DNA to pass through. Double stranded DNA can be eluted by raising temperature and its quantity measured (redrawn from Sci. Amer. 222, April, 1970).
Fig. 28.3. Denaturation and reassociation of DNA containing six copies of repetitive DNA (AA;) shown by thin lines and one copy each of four different unique or single copy DNA's (B-B'; C-C’; D-D; E-E') shown by thick lines. Note that more repetitive DNA has reassociated than the single copy DNA. This principle is used for determining the proportion of repetitive DNA in a genome (redrawn from Sci. Amer. 222: April, 1970).
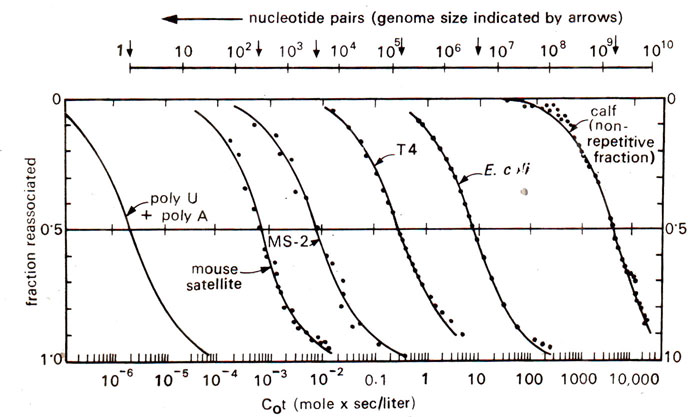
Fig. 28.5. Reassociation patterns of double stranded DNA from various sources. All curves are typical S-shaped indicating homogeneity, but they are displaced to different values to Cot due to genome size.
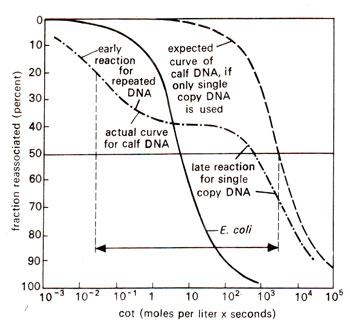
Fig. 28.6. Reassociation patterns of bacterial and calf DNA. Note that the reaction on calf DNA takes place in two stages, one early representing repetitive DNA and the other representing single copy DNA. Midpoints of these two stages are indicated by dotted vertical lines, separated by a factor of 1000,000 (for details see text), (redrawn from Sci. Amer. 222:. April, 1970).
Fig. 28.5. Reassociation patterns of double stranded DNA from various sources. All curves are typical S-shaped indicating homogeneity, but they are displaced to different values to Cot due to genome size.
Fig. 28.6. Reassociation patterns of bacterial and calf DNA. Note that the reaction on calf DNA takes place in two stages, one early representing repetitive DNA and the other representing single copy DNA. Midpoints of these two stages are indicated by dotted vertical lines, separated by a factor of 1000,000 (for details see text), (redrawn from Sci. Amer. 222:. April, 1970).
Support our developers


