Replicon Clusters: Labeling Strategies for the Analysis of Chromosome Architecture and Chromatin Dynamics
I. INTRODUCTIONIn all eukaryotes, the maintenance of genetic integrity requires that DNA replication is controlled precisely to ensure that a perfect set of chromosomes passes to each of the daughter cells during cell division. Mammalian chromosomes are so long that DNA synthesis must initiate at many positions on each in order to complete S phase in the observed time framemtypically 8-10 h. Direct observation of sites of DNA synthesis on spread DNA fibres shows that initiation events are spaced roughly 150 kb apart, giving ~1000 on a typical human chromosome. However, the initiation events are not performed simultaneously at all sites at the onset of S phase. Instead, small groups of origins within replicon clusters are activated at the onset of the replication programme such that only about 10% of possible origins operate at this time. Replication proceeds from these early origins until some unknown switchmprobably related to changes in chromatin structure that arise during this first phase of synthesismallows new sets of replicons to be activated. Different banks of replicons are activated in this progressive fashion until the replication process is complete.
During each phase of synthesis small clusters of replicons are activated together (Fig. 1). These clusters typically contain two to five adjacent replicons and appear to form stable units of chromosome structure, with ~0.5-1 Mbp DNA (Jackson and Pombo, 1998; Ma et al., 1998; Zink et al., 1998; Cremer and Cremer, 2001). The ability to label replicon clusters in mammalian cells to reveal DNA or replication foci provides an outstanding opportunity to analyse many aspects of chromosome architecture and chromatin function. The basic principle behind the approach is facile and relies on the use of modified DNA precursor analogues that can be incorporated into DNA in place of the natural precursor and subsequently detected to reveal sites of incorporation.
Bromodeoxyuridine (BrdU) was the first compound to find common use in this approach (Dolbeare, 1995). BrdU can be added to culture mediummor indeed introduced by injection into whole animalsmand is incorporated into DNA in place of thymidine. Patterns of incorporation can subsequently be visualised. Initially, low resolution techniques were used that relied on the variable biochemical properties of the BrdU-containing chromatin. The subsequent use of immunostaining techniques using antibromo antibodies (Gratzner, 1982) and fluorescence-based detection systems revolutionised the analysis of replicon clusters labelled in this way. In the seminal experiment, Nakamura et al. (1986) used BrdU incorporation and indirect immunofluorescence to show that early replication in rat embryonic fibroblasts occurred at some 130 sites that were each estimated to contain at least 10 active replicons. Further studies have defined a replication programme (Fig. 2), with characteristic patterns of synthesis correlating with the duplication of specific regions of the genome at different times during S phase (Nakayasu and Berezney, 1989; Humbert and Usson, 1992; O'Keefe et al., 1992; Hozák et al., 1994). The activation of specific groups of replicons also correlates with the structured assembly of active replication centres-also called replication "factories" (Hozák et al., 1993)-in the vicinity of active foci. These replication factories are assembled transiently at the appropriate sites in response to factors that determine the progress of S phase. The distribution of active sites appears to be influenced by fundamental features of nuclear structure. Many proteins involved in the replication machinery have targeting signals that direct their association with the active sites. The sites are dynamic, however, and can be shown using green fluorescent protein (GFP)-tagged replication proteins, such as proliferating cell nuclear antigen (PCNA) (Leonhardt et al., 2000), to assemble shortly before synthesis begins and disassemble as replication within a particular factory is complete.
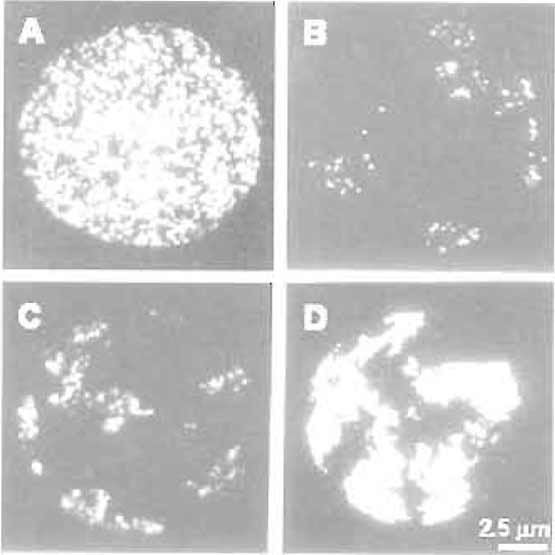 |
| FIGURE 1 Chromosome territories in mammalian cells. HeLa cells were labelled with BrdU at the onset of S phase for 20min (A and B), 3 h (C), and 10 h (D). Cells were attached to glass slides using the standard chromosome spreading technique, and BrdUcontaining sites were visualised by immunofluorescence immediately after labelling (A) or 5 days later (B-D). Note the structure of individual replication foci and their organisation in individual chromosome territories (B-D). (D) Individual territories are labelled throughout S phase so that the boundary of each territory is seen. Bar: 2.5µm. For details, see Jackson and Pombo (1998). |
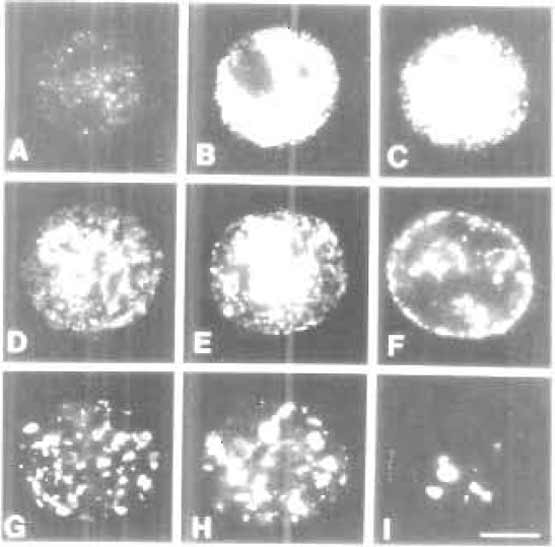 |
| FIGURE 2 The S-phase programme. During S phase, different classes of DNA elements are replicated at specific times. Chromatin with the majority of transcribed genes is replicated over the first ~4h of the S phase. During this period, active sites of DNA synthesis are in discrete foci dispersed throughout the nuclear interior (A-C). These are designated early or type 1 replication patterns. During mid-S phase (D-F) replication switches to peripheral inactive chromatin. These mid-S phase patterns are also referred to as type 2 (D and E) and type 3 (F) patterns. During late S phase (G-I) the replication of extended blocks of constitutive heterochromatin occurs throughout the nuclear interior. These late S phase patterns are also referred to as type 4 (G-H) and type 5 (I) patterns. Encapsulated HeLa cells were synchronised at the onset of S phase, and replication sites were labelled at 1-h intervals for 10 h. Images shown are replication sites labelled in permeabilised cells using biotindUTP. For details, see Hozak et al. (1994) and O'Keefe et al. (1992). Bar: 5 µm. |
Chromosome Structure and Dynamics
Mammalian chromosomes are highly structured. This is evident from the fact that their condensation during mitosis occurs in such a way that specific chromosomes from different cell types can be readily recognised if they are stained in specific ways. The banded chromosomal patterns revealed by stains such as Giemsa correlate with differences in gene density (transcriptionally active R bands have roughly fourfold the gene density of G bands), slight differences in base composition (R bands are commonly 3-5% more GC rich), and variations in chromatin structure (antibodies that recognize histone modification associated with gene activity stain R bands). Fundamental features of this organization persist during interphase when individual chromosomes maintain spatially discrete nuclear "territories" (Cremer and Cremer, 2001).
In mammalian nuclei, chromatin is locally dynamic but only over short distances, typically <100 nm. Longrange movement is constrained, and the best models for the corresponding organisation predict randomly arrayed structural subunits of roughly 1Mbp DNA (Cremer and Cremer, 2001), the typical size of DNA foci. The possibility that clusters of replicons act as stable cohorts that determine chromosome architecture and drive critical aspects of chromatin function, such as the replication programme, is an exciting insight that emphasises the importance of structurefunction relationships.
In order to study this in living cells, strategies have been developed to label DNA foci with fluorescent precursor analogues so that it is now possible to perform detailed studies of the dynamic relationships between different foci and explore if these structures dictate fundamental features of chromosome structure and function.
II. MATERIALS AND INSTRUMENTATION
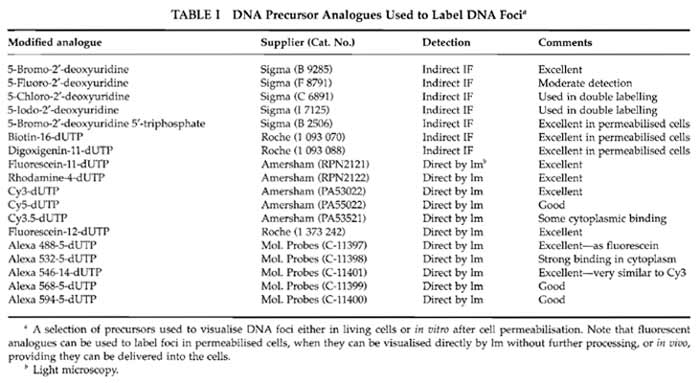
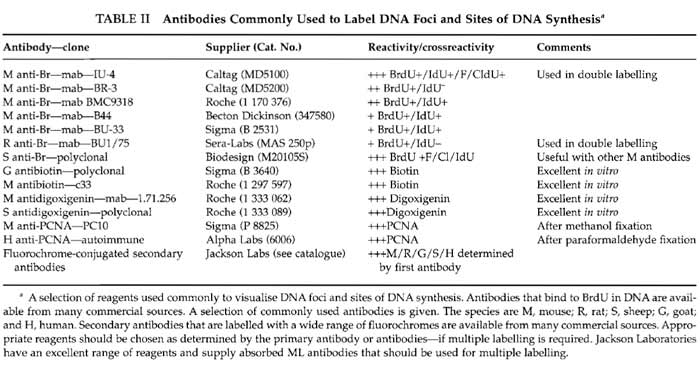
Solutions are prepared in molecular biology grade water from BDH Laboratory SupplieS (Cat. No. 443847D). Cell culture media from Sigma-Aldrich are modified as required by the cells under study. For many purposes it is convenient to use HeLa cells grown in Dulbecco's MEM (Cat. No. D 5546) supplemented with penicillin and streptomycin (Cat. No. P 0781), sodium pyruvate (Cat. No. S 8636), glutamine (Cat. No. G 7513), and 5% foetal bovine serum (Cat. No. F 7524). Reagents for in vitro labelling are from Sigma-Aldrich: potassium acetate (Cat. No. P 5708), potassium chloride (Cat. No. P 9333), disodium hydrogen phosphate (Cat. No. S 7907), potassium hydrogen phosphate (Cat. No. P 9791), magnesium chloride (Cat. No. M 1028), adenosine triphosphate (Cat. No. A 7699), dithiotheritol (Cat. No. D 5545), phenylmethylulfonyl fluoride (PMSF; Cat. No. P 7626), deoxynecleoside triphosphate set (Cat. No. DNTP-100), nucleoside triphosphates (Cat. Nos. A 6559; C 8552; G 3776; U 1006), phosphate-buffered saline (PBS; Cat. No. P 4417), Triton X-100 (Cat. No. T 9284), saponin (Cat. No. S 7900), digitonin (Cat. No. D 1407), lysolecithin (Cat. No. L 4129), DNase I (Cat. No. D 7291), hydrocholric acid (Cat. No. H 1758), sodium borate (Cat. No. B 0127), acetic acid (Cat. No. A 0808), methanol (Cat. No. M 3641), low melting agarose (type VII-A; Cat. No. A 0701), poly-L-lysine (Cat. No. P 4707), bovine serum albumin (fraction V; Cat. No. A 4503), Tween 20 (Cat. No. P 7949), trypan blue (Cat. No T 8154), Hanks' balanced salt solution (HBSS; Cat. No. H 9269), and 4',6- diamidine-2-phenylindole dihydrochloride (DAPI; Cat. No. D 8417). Inhibitors used for cell cycle studies are from Sigma-Aldrich: thymidine (Cat. No. T 1895), aphidicolin (Cat. No. A 0781), nocodazole (Cat. No. M 1404), and colcemid (Cat. No. D 7385). The protease inhibitor set (Cat. No. 1 206 893) and FuGene 6 (Cat. No. 1 815 091) are from Roche Applied Science. Liquid paraffin (Cat. No. 29436) is from BDH. The electron microscopy grade 16% paraformaldehyde solution is from Electron Microscopy Sciences (Cat. 15710-S). Vectashield is from Vector Laboratories (Cat. H 1000). TOTO III iodide is from Molecular Probes (Cat. T- 3604). Different DNA precursor analogues that may be used to label DNA foci are indicated in Table I, and antibodies used for indirect immunolabelling are detailed in Table II. Plastics for cell culture are from Nunc, and prewashed glass slides and coverslips are from BDH. Culture dishes for live cell imaging are from IWAKI (Cat. 3911-035) or MatTek Corporation (Cat. P35GC-0-14-C), and coverslips with location grids are from MatTek Corporation (Cat. P35G-1.5-7-Cgrid). Radioactive nucleotides are from Amersham Biosciences.
The routine procedures described later are commonly used to analyse replication foci at the single cell level. Accordingly the output will be recorded using light microscopy with epifluorescence capabilities. Many commercially available light microscopes are capable of generating the necessary output; the particular choice will depend both on the instrumentation that is readily available and on the specific aims of the analysis. For high-resolution work, an advanced machine such as the Zeiss LSM 510 or equivalent from other manufacturers should be used. For many applications it will be adequate to use a much simpler microscope equipped with a CCD camera. Certain labelling strategies can be adapted to study cell cycle parameters using flow cytometry techniques. Finally, if specific emphasis needs to be placed on the extent of DNA synthesis, it is often necessary to perform a single cell analysis in conjunction with radiolabelling. The incorporation of (32p)dNTPs into DNA is measured using a scintillation counter.
III. PROCEDURES
A. Labeling Replication Foci in Cells Growing in Culture
5-Bromo-2'-deoxyuridine is phosphorylated by cells to give BrdUTP and this precursor is incorporated into DNA in place of dTTP.
Solutions
- Prepare appropriate culture medium-as required by cells under investigation.
- Prepare stock solution of desired replication precursor analogue (Table I; e.g., BrdU) in medium. For most purposes, it is convenient to prepare a 100× stock. Labelling is usually performed at 10-50µM BrdU, depending on the duration of labelling. Higher concentrations may be used for very short pulses, although concentrations in excess of 50µM may lengthen the cell cycle. IdU is much less soluble than BrdU and should be made as a 10× stock.
 |
1. Adherent Cells
Steps
- Place clean, sterile 13-mm glass coverslips in a 60-mm petri dish and coat with poly-L-lysine by applying a drop of sterile 0.01% solution for 1 h.
- Rinse coverslips with medium and seed ~2 × 10⁵ cells in 2ml fresh medium and grow for 16-24h or until cells reach ~50% confluency.
- Replace medium with fresh medium containing 10-50µM BrdU and incubate for 1-10h. The concentration should be modified according to the labelling time requiredmuse lower concentrations for longer labelling periods. For very short pulse labels, concentrations in the range of 50-200µM BrdU can be used.
- Rinse samples in PBS at room temperature and prepare for immunolabelling.
2. Nonadherent Cells
Nonadherent cells can be labelled directly in suspension in medium. However, for many in vivo and in vitro applications it is convenient to use cells encapsulated in agarose microbeads (Jackson and Cook, 1985). For some applications, particularly high-resolution analyses using electron microscopy (e.g., Hozak et al., 1993), it is also convenient to perform experiments on adherent cells that are encapsulated after removing from the surface on which they normally grow. Use the following steps to encapsulate cells.
Steps
- Warm 10 ml liquid paraffin to 37°C.
- Heat 0.25g low-gelling agarose in 10ml PBS at ~95°C until dissolved and cool to 37°C.
- Resuspend ~107 cells (a final cell density of 2 × 10⁶ cells/ml beads is ideal for this application, although a wide range can be used) in 4ml PBS at 37°C in a 100-ml round-bottomed flask.
- Add 1 ml agarose solution at 37°C to 4 ml cell suspension at 37°C and mix thoroughly.
- Add 10ml paraffin at 37°C, seal flask with plastic film, and immediately shake (by hand or at 800 cycles/min using a flask shaker) until a creamy emulsion forms (~15s).
- Cool flask by periodic rotation in ice-cold water for 10min; this allows spherical droplets of molten agarose suspended in the paraffin to gel.
- Add 35 ml ice-cold PBS, mix, and transfer to a 50- ml plastic centrifuge tube.
- Pellet microbeads by spinning at 1000rpm on a bench centrifuge at 20°C.
- Aspirate the supernatant and wash pelleted microbeads once in PBS. If some beads remain at the water/paraffin interface, remove most paraffin, mix thoroughly, and respin.
- Encapsulated cells can now be regrown in medium or permeabilised directly.
Incorporate BrdU or alternative precursor analogue into encapsulated cells as follows.
Steps
- Use cells adapted for suspension culture or cells encapsulated in agarose microbeads at a density of ~2 × 10⁶/ml and grow in fresh medium for at least 1 h.
- Add 10-50µM BrdU for 1-10h; use a higher concentration if shorter pulse times are required (see earlier discussion).
- As an optional step, double labelling can be performed using iododeoxyuridine (IdU) and chlorodeoxyuridine (Aten et al., 1992) or IdU and BrdU (Jackson and Pombo, 1998). After the first pulse, e.g., 20µM BrdU for 1 h, wash samples once in fresh medium by centrifugation (1000 rpm) and resuspension and add medium with a second precursor for a second pulse, e.g., 20 µM IdU for 1 h.
- Wash in PBS at room temperature and prepare for immunolabelling. The routine procedure for washing agarose microbeads is facile. Beads pellet readily during centrifugation at ~1000 rpm in a benchtop centrifuge for 1-2 min. The supernatant can then be aspirated (with care no beads should be lost) and the bead pellet resuspended in any solution of choice.
3. Labeling in vitro
For many applications, labelling in vitro using permeabilised cells provides an appealing versatility. A major advantage of this option is that replication elongation rates can be manipulated precisely by adjusting the concentration of the precursor pools, incubation time, and temperature. It is also convenient to use a much wider variety of modified precursors (Table I), as permeabilised cells do not restrict access of the dNTPs to the nucleus. The chromatin structure is especially sensitive to changes in its ionic environment, and the choice of the buffer to use with permeabilised cells is particularly important. Many buffers are in common use, but the following "physiological buffer" (PB) is useful for preserving critical features of nuclear structure and function.
Solutions
- Prepare PB containing 100 mM KCH3COOH, 30 mM KCl, 10 mM Na2PO4, 1 mM MgCl2, 1 mM Na2ATP, 1 mM dithiothreitol, and 1 mM PMSF and add 100 mM KH2PO4 as required to give pH 7.4. Protease and nuclease inhibitors should be added to suit the demands of particular experiments.
- In PB, prepare 10× concentrated initiation mix to give the following final concentrations: 250 µM dATP, 250 µM dCTP, 250 µM dGTP, 100 µM CTP, 100 µM GTP, 100 µM UTP, and 10-100 µM TTP analogue (Table I), plus MgCl2 at a molarity equal to that of the triphosphates.
Comments and Pitfalls
Various combinations of monovalent anion can be used. Different chloride/acetate/glutamate (or polyglutamate) combinations support similar rates of replication. However, acetate/glutamate is preferred to the smaller Cl-, which is more damaging to the tertiary protein structure. The concentration of divalent cations must be controlled carefully. As little as 0.5 mM free Mg2+ causes the visible (by EM) collapse or aggregation of chromatin. The equimolar Mg/ATP combination used here preserves the chromatin structure and supports the action of Mg-dependent enzymes. Dithiothreitol, protease inhibitors, and ribonuclease inhibitors protect the sample and preserve cell morphology.
Steps
- Prepare cells on coverslips or encapsulated in agarose microbeads as described earlier.
- Wash samples in ice-cold PB to remove medium and permeabilise for ~2min using 0.01-0.1% of a suitable detergent.
- Wash cells three times in ice-cold PB to remove the detergent.
- Incubate coverslips or microbeads in PB at 33°C for 5 min.
- Add one-tenth volume of 10× IM, mix, and incubate at 33°C for 2-60 min.
- Wash three times in >10 volumes ice-cold PB and proceed to fix and label.
Comments and Pitfalls
The choice of detergent will depend on the requirements of a particular experiment. We commonly use saponin at 0.01%, as this preserves nuclear structure and supports endogenous levels of DNA or RNA synthesis. The extent of lysis is critical. To define conditions, use a twofold dilution series of detergent in PB and assess the level of permeabilisation using trypan blue exclusion (add 50 µl 1% trypan blue in PB to a coverslip or 50 µl packed microbeads; after 2min, inspect by light microscopy; score percentage permeabilised, dark-blue cells). Choose the detergent concentration that permeabilises ~95% cells. If cells detach from coverslips during washing, use a lower concentration of detergent. The following (and related) detergents can be used (guideline concentrations are indicated): 0.02-0.05% Triton X-100; 0.01-0.02% saponin; 0.01-0.02% digitonin; and 0.02-0.05% lysolecithin.
The concentration of modified precursor and duration of labelling can be adjusted to suit individual requirements. The following provides some guidelines. Fifteen-minute incubations with 20 µM biotin- or digoxigenin-coupled precursors give good indirect immunofluorescence signals, and longer incubations give correspondingly stronger signals. Five- and 2-min incubations with 100 µM biotin-16-dUTP allow detection by light and electron microscopy, respectively, using standard detection protocols. Incorporated labels can be detected after ~30-min incubations with 20 µM fluorescent precursors. Overall levels of incorporation can be quantitated by incorporating a radioactive tracemtypically [Pg2]dCTPminto the reaction; use ~50µCi/ml [P32]dCTP and reduce dCTP pool to ~10 µM.
If inhibitors are to be used, incubate them for 15 min at 0°C prior to the addition of 10× IM.
B. Chromosome and Nuclear Spreads
Samples labelled in suspension can be fixed onto a glass surface using a standard chromosome spreading technique (Fig. 1).
Solutions
- Hanks balanced salt solution (HBSS).
- Prepare 0.075M KCL in distilled water.
- Prepare 3:1 (v/v) methanol:acetic acid fixative.
Steps
- In a 10-ml plastic tube, wash cells labelled with DNA precursor analogue once in HBSS at room temperature. Resuspend the cell pellet in 0.075M KCl (0.5-1 × 10⁶ cells/ml) and incubate at 37°C for 15min to swell the cells.
- Using 2-5ml of swollen cell suspension in a 10-ml plastic centrifuge tube, prefix cells by adding 3 drops/ml of methanol/acetic acid (3:1)-add the fixative dropwise from a Pasteur pipette while agitating the cell suspension gently. Leave the mix at room temperature for 15 min.
- Pellet cells at 1000rpm, aspirate the supernatant gently, and resuspend the pellet (by gentle agitation of the tube) in methanol/acetic acid (3:1). Stand at room temperature for 1 h.
- Pellet the sample once more and resuspend cells in fresh methanol/acetic acid at 2 × 10⁶ cells/ml. Spread immediately.
- Glass slides should be rinsed in detergent (e.g., Decon 90), washed extensively in double-distilled water, and chilled to 4°C in water. Take a chilled slide, drain off excess water, and hold the slide at a ~30° angle against a work surface. Immediately drop 2-3 drops of the cell suspension from a Pasteur pipette onto the centre of the slide. The organic solvent and fixed cells will spread in the water film to cover most of the slide.
- Place the slide on paper towels soaked in iced water and allow to dry. The dried slides can be stored in a fridge for many days before immunolabelling.
Comments and Pitfalls
If the analysis requires significant numbers of mitotic cells, it is usual to begin by growing cells for 30-60min in medium supplemented with colcemid (50ng/ml). This drug disrupts microtubule function and blocks cells in metaphase.
Hydrodynamic properties of the drying spread have a significant impact on the quality of mitotic spreads. Reproducibly high-quality spreads are usually obtained if the speed of drying is controlled by placing slides on cold, damp paper towels.
C. DNA Fibre Spreads
Many important aspects of the biology of replication clusters, as well as fundamental features of the replication process, can be studied using appropriately labelled DNA fibre spreads (Jackson and Pombo, 1998; Takebayashi et al., 2001).
Solutions
- Prepare PBS in distilled water.
- Prepare lysis mix with 0.5% (w/v) SDS, 200mM Tris-HCl (pH 7.4), and 50mM EDTA in distilled water.
- Prepare 3:1 (v/v) methanol:acetic acid fixative.
Steps
- Harvest cells labelled with the appropriate DNA precursor analogue (or analogues for multiple labelling) and resuspend in PBS at 106 cells/ml.
- Take a clean glass slide and place 2µl of the cell suspension on the slide, about 2 cm from one end. Leave the sample to stand for about 10min so that the cells settle on to the glass surface; do not allow the sample to dry completely.
- Add 5 µl of lysis mix to the cell sample and let stand for 5 min at room temperature to lyse the cells.
- Tilt the slide to a ~20° angle so that the cell lysate flows as a uniform smear to the bottom of the slide (the smear will be about 4cm).
- Lie the slide on a flat surface and allow the spread sample to dry.
- Fix the sample by immersing the slide in methanol/acetic acid (3:1) for 5 min.
- Remove slides from the fixative and allow them to dry. The dried slides can be stored in a fridge for many days before immunolabelling.
D. Immunolabeling Procedures
Cell structures with incorporated DNA precursor analogues must be stabilised by fixation prior to immunolabeling. For light microscopy techniques, paraformaldehyde is the fixative of choice. Samples treated with methanol/acetic acid can be stained directly, although for some applications it is also advantageous to postfix samples with paraformaldehye. Fixation and immunolabeling procedures used for electron microscopy are specialised and beyond the scope of this article. For details of these techniques, see Hozák et al. (1993, 1994).
Solutions
- Prepare PBS or physiological buffer (PB; see earlier discussion) in distilled water.
- Prepare 4% paraformaldehyde in PBS or PB.
- Prepare 0.25% Triton X-100 in PBS or PB.
1. Cells on Glass
Steps
- After rinsing in PBS, place coverslips or slides in 4% paraformaldehyde for 10min at room temperature. Permeabilised cells labelled in vitro should also be fixed in this way but must be first washed in buffer to remove unincorporated precursors.
- Wash samples twice with PBS.
- Permeabilise cells by incubation in 0.25% Triton X-100 in PBS for 2min at room temperaturemthis improves subsequent access of the antibodies.
- Wash gently in PBS (three changes over 5 min). Samples can now be labeled with antibodies.
2. Encapsulated Cells
Steps
- After labelling in vitro, remove unincorporated precursors by washing beads three times in 10 volumes ice-cold PB for 15 min.
- Permeabilise by incubating in 0.25% Triton X-100 in PB for 10 min at 0°C.
- Wash three times in 10 volumes ice-cold PB.
- Fix in ice-cold 4% paraformaldehyde in PB for 10 min.
- Wash three times in 10 volumes ice-cold PBS. Samples can now be labelled with antibodies as described later.
3. Antibody Binding
Commercial anti-BrdU antibodies (Table II) react poorly with BrdUMP in native DNA. Binding is increased 10- to 20-fold if DNA is first denatured.
 |
i. Acid Denaturation
Solutions
- Prepare 2M HCl by diluting concentrated acid in distilled water.
- Prepare 0.1M Na2B4O7 dissolved in distilled water.
- PBS/BSA/Tween is PBS containing 0.5% BSA and 0.1% Tween 20.
Steps
- Rinse slides or coverslips in distilled water.
- Denature DNA in 2M HCl for 1 h at room temperature.
- Rinse five times in 0.1M Na2B4O7 to remove acid.
- Rinse twice in PBS/BSA/Tween and incubate samples with PBS/BSA/Tween for 1-2h in a humid atmosphere at room temperature to block nonspecificbinding sites.
- Add first antibody, cover sample with a few drops of PBS/BSA/Tween and 1/50 to 1/500 dilution (determine empirically) anti-BrdU antibody, and incubate 1-2h in a humid atmosphere at room temperature.
- Wash five times in PBS/BSA/Tween at room temperature for 1 h.
- Add second antibody. Cover the sample with a few drops of PBS/BSA/Tween and 1/500 to 1/1000 dilution of the labelled second antibody (Table II) and incubate 1-2h in a humid atmosphere at room temperature. The second antibody should be selected to react with antibodies from the species in which the first antibody was developed (Table II).
- Wash five times in PBS/BSA/Tween at room temperature for 1 h.
- Prepare samples for microscopy using an appropriate mountant (e.g., Vectashield) and seal coverslips with nail varnish.
- Inspect samples using a suitable microscope.
Comments and Pitfalls
Fluorochrome-coupled second antibodies give high resolution and can be analyzed using confocalscanning light microscopes and sensitive chargecoupled device (CCD) cameras. Fluorescence-based detection systems also allow convenient multiple labelling (e.g., Aten et al., 1992; Jackson and Pombo, 1998; Schermelleh et al., 2001). As an alternative, it is also possible to detect the location of the incorporated precursor using enzyme-coupled second antibodies (such as alkaline phosphatase). This approach is used in routine histology of tissue sections but generally offers lower resolution.
ii. Nuclease-Dependent Denaturation.
Acid denaturation is accompanied by some loss of morphology. If morphological considerations are critical, nucleasedependent detection systems are preferred.
Solution
PBS/BSA/Tween is PBS containing 0.5% BSA and 0.1% Tween 20.
Steps
- Rinse slides or coverslips once in PBS, twice in PBS/ BSA/Tween, and incubate in PBS/BSA/Tween for 1 h at room temperature.
- Add first antibody, cover samples with a few drops of PBS/BSA/Tween, 1/50 to 1/500 dilution anti- BrdU antibody, and 50µg/ml DNase I (Sigma), and incubate 1-2 h in a humid atmosphere at 37°C.
- Perform steps 6-11 as following acid denaturation described earlier.
iii. Encapsulated Cells
Solutions
- PBS/BSA/Tween is PBS containing 0.5% BSA and 0.1% Tween 20.
- 0.02mg/ml DAPI in sterile distilled watermthis is a 1000× stock.
Steps
- Wash beads containing fixed cells twice in icecold PBS/BSA/Tween and incubate in PBS/BSA/ Tween for 1 h at 0°C.
- Add first antibody, mix 100µl beads with 400µl PBS/BSA/Tween containing 1/50 to 1/500 dilution of appropriate first antibody, and incubate at 0°C for 2h with periodic mixing.
- Wash three times in 10 volumes ice-cold PBS/ BSA/Tween for 30 min.
- Add second antibody, mix the bead pellet with 400µl PBS/BSA/Tween containing 1/500 dilution of appropriate fluorochrome-coupled second antibody (Table II), and incubate at 0°C for 2h with periodic mixing.
- Wash three times in 10 volumes ice-cold PBS/ BSA/Tween for 30min.
- Wash three times in 10 volumes PBS at room temperature with 5min between washes; add 0.02µg/ml DAPI or 1/250 dilution TOTO III iodide (fluorescence in the far red spectrum) to second wash.
- Mount by mixing 5µl beads with an equal volume of mounting medium (Vectashield), apply coverslip with gentle pressure to eliminate excess fluid, and seal with nail varnish.
- Inspect samples using a suitable microscope.
E. Patterns of DNA Synthesis
The techniques detailed earlier allow visualisation of labeled DNA foci. These foci can be analysed by indirect immunolabeling either immediately after incorporation or many hours later. If the precursor analogue (e.g., BrdU) is added to cells for <30 min and indirect immunolabeling is performed immediately, most labeled sites will correspond with sites of ongoing DNA synthesis. This can be confirmed by labeling DNA foci (as described earlier) in conjunction with a marker for the replication factory. Antibodies to PCNA are generally used for this purpose. Cells labeled either in vivo (Nakamura et al., 1986) or in vitro (Nakayasu and Berezney, 1989) to reveal the sites of nascent DNA synthesis display a few hundred discrete nuclear sites, with patterns that are characteristic of different stages of S phase (O'Keefe et al., 1992; Humbert and Usson, 1992). Foci labeled after very short incubations are associated with massive protein complexes (Hozák et al., 1993) where many replicons are duplicated together.
1. Labeling Sites of Ongoing DNA Synthesis
While nascent sites of DNA synthesis can be labeled in living cells using short pulse labels of appropriate analogues (e.g., BrdU), for technical reasons it is preferable to label nascent sites in vivo using permeabilised cells. The major advantages of in vitro labeling are that precursors dNTP (e.g., biotin-dUTP) can be used directly and that soluble pools of unassembled replication proteins are lost during cell lysis.
Solutions
- Physiological buffer as detailed earlier.
- 0.2% (w/v) saponin in PB-this is a 20× stock lysis solution.
- 10× IM mix as indicated earlier supplemented with 20 µM biotin-dUTP.
- 4% paraformaldehyde in PB.
Steps
- Permeabilise cells growing on coverslips or encapsulated in agarose microbeads and label for 15-30min with a suitable labelled precursor analogue as described earlier. Biotin-dUTP is recommended for this application, although it may be convenient to label the nascent DNA directly using a fluorescent precursor analogue (Table I).
- If biotin-dUTP is used, wash samples three times in PB to remove the unincorporated precursor and fix the samples in 4% paraformaldehyde in PB as described earlier.
- Visualise sites of incorporation as described earlier, using an antibody to biotin (Table II).
- The engaged replication machinery can be visualised in the same samples using an antibody to a protein component such as PCNA using the standard indirect immunolabelling technique: in PBS/BSA/ Tween add 1/500 dilution of the first anti-PCNA antibody for 1-2h, wash with PBS/BSA/Tween, and then apply appropriate fluorescently labelled second antibodies in PBS/BSA/Tween as described earlier. Wash the samples and mount as described earlier.
Comments and Pitfalls
PCNA antibodies can be used to visualise assembled replication proteins. The antibody from Alpha Laboratories is a human autoimmune serum and can be applied to samples directly. PC10, a mouse monoclonal antibody, reacts poorly with PCNA at replication sites fixed in paraformaldehyde. To use this reagent, samples should be fixed by incubating for 10 min in methanol at -20°C.
F. Chromosome Dynamics and Live Cell Techniques
Many directly labeled fluorescent analogues of DNA synthesis precursors can be used to visualise replication foci in living cells (Pepperkok and Ansorge, 1995; Zink et al., 1998; Manders et al., 1999). However, one limitation of this approach arises from the inability of these charged molecules to cross the cell membrane. Many techniques have been evaluated to address this problem. Microinjection (Pepperkok and Ansorge, 1995; Zink et al., 1998) is an obvious possibility but this is technically tedious and only ideally suitable for labelling small numbers of cells. Other alternatives include bead loading (Manders et al., 1999) scratch loading (Schermelleh et al., 2001) and the use of synthetic carrier complexes.
1. Scratch Loading
Solutions
- Culture medium-as required for the specific cell type under study.
- Culture medium supplemented with 10-20 µM dNTP analogue (Table I).
Steps
- Cells should be 50-75% confluent and growing on glass coverslips or culture dishes with glass inserts.
- Remove the medium and apply medium with fluorescent analogue -use 10 µl for each 13 mm diameter and proportionally more if larger samples are used.
- Use the tip of a fine hypodermic needle to scratch a series of parallel lines across the coverslip surface -it is convenient to use lines separated by about 0.5-1 mm.
- After 1 min, add 0.5 ml of prewarmed medium and let stand in incubator for 30min.
- Finally, wash in medium to remove any unincorporated precursors, add medium to normal growth conditions, and return culture dish to a humidified incubator until use.
2. Carriers
Carrier-mediated delivery of fluorescent nucleotides (Table I) can be performed as follows.
Solutions
- For each coverslip, prepare 3µl of the transfection reagent FuGENE 6 mixed with 12µl PBS and incubate at 4°C for 5 min.
- Add 1.5 µl of the desired fluorescent nucleotide analogue, mix, and incubate at 4°C for 20min.
Steps
- Grow cells on 13-mm coverslips coated with poly-L-lysine as described earlier.
- Pipette the fluorescent nucleotide carrier complex (16.5 µl) onto a piece of parafilm and place the coverslip (cell face down) on the droplet for 15min at 4°C.
- Rinse the cells in full medium, replace with fresh medium, and return samples to an incubator prior to analysis or further labelling treatments.
- If further analogues are to be used, simply repeat the procedure at the desired time interval. Note, however, that repeated applications do influence cell viability, which is particularly pronounced if two or more analogues are added consecutively without allowing cells time to recover. Good results are obtained if the separation between applications is at least 2 h.
- Samples can be inspected directly following incorporation; using this technique, fluorescent nucleotides introduced into an S-phase cell are consumed in ~30min. For live cell experiments, transfer the labelled cells into culture dishes with poly-L-lysine-coated glass coverslip inserts. Culture dishes with gridded coverslips are also of use for relocating individual cells during long-term analysis.
- Inspect samples using a convenient microscope adapted for live cell imaging.
In living cells, studies of the dynamics of DNA foci and their association with replication machinery can be performed by labelling DNA foci in cells that have a component of the replication machinery, such as PCNA, tagged with GFP (Leonhardt et al., 2000).
G. Cell Cycle Analysis
In vertebrates, important features of the replication process have been revealed using cell populations that have been synchronised at critical points of the cell cycle. Two points in the cycle are generally amenable to cell synchronisation. First, reagents that disrupt microtuble function (e.g., nocodazole or colcemid) allow cells to accumulate in mitosis. Cells that generally grow as adherent monolayers can be purified in mitosis using simple shake-off techniques that dislodge only mitotic cells. Many compounds can be used to accumulate cells at or close to the beginning of S phase. Aphidicolin is the reagent of choice, as inhibition is readily reversible and low concentrations added to medium specifically inhibit the elongation phase of DNA synthesis. The following protocol was used to demonstrate the efficiency with which human replicons are activated in different cell cycles (Jackson and Pombo, 1998).
Solutions
- Full medium, as required by cells under study - serum should be added to support optimal growth.
- 250mM thymidine in sterile distilled water - this is a 100× stock solution.
- 50µg/ml nocodazole in sterile distilled water-this is a 1000× stock solution.
- 5mg/ml aphidicolin in DMSO - this is a 1000× stock solution.
- 10-100× stock solution of required DNA synthesis precursor analogue (Table I) in medium.
Steps
- Synchronise cells in mitosis by incubating sequentially in medium supplemented with (i) 2.5 mM thymidine for 24 h; (ii) no additive for 12 h; (iii) 2.5 mM thymidine for 12h; (iv) no additive for 10h; and (v) 50ng/ml nocodazole for 4h. To remove inhibitors, remove medium, wash cells once in fresh medium for 5 min, and replace with fresh medium.
- Wash cells to remove nocodazole and incubate in fresh medium for 4-7h.
- Add 5µg/ml aphidicolin for 2-3 h.
- Wash cells in fresh medium supplemented with a suitable precursor analogue (e.g., BrdU) and incubate for 15-30 minutes as described previously. This will pulse-label DNA foci in cells accumulated at the onset of S phase.
- Return cells to fresh full medium.
- After a specified time, typically 1-5h, samples can be pulse labelled further in medium supplemented with a second precursor analogue (e.g., IdU).
- Alternatively, from 12h to many days later, steps 1-5 can be repeated using a second precursor analogue (e.g., IdU).
- Indirect immunodetection of the two incorporated analogues can now be performed on fixed cells or spread DNA fibres as detailed earlier.
Comments and Pitfalls
Timings must be determined empirically, as different cell lines each have characteristic cell cycle parameters. Trial experiments should be performed to establish the time interval between releasing cells from mitosis and the onset of S phase. For most mammalian cell lines, cells synchronised in mitosis enter S phase after 5-10h. Because G1 is the most variable period of the cell cycle, additional aphidicolin treatment is required to accumulate cells at the very beginning of S phase. Conditions should be used that give 20-50% cells undergoing replication.
The same approach can be applied using directly labelled analogues for live cell imaging.
Using a combination of pulse labelling and fluorescent in situ hybridisation (FISH) on DNA fibres, it is also possible to analyse where DNA synthesis initiates at specific chromosomal loci (Takebayashi et al., 2001).
H. Reconstituting Replication Sites
The protocols detailed earlier have been developed to visualise DNA foci and sites of nascent DNA synthesis in intact or permeabilised cells. For some applications it is convenient to extend our knowledge of the replication process using systems that are amenable to manipulation in vitro. While it is beyond the scope of this article to cover these applications in detail, the authors would like to comment on their potential merits. The best system in vertebrates takes advantage of the ability of Xenopus laevis egg extracts to assemble nuclei when incubated with a suitable DNA (commonly from sperm). Reconstituted nuclei are formed that perform a single but complete round of DNA synthesis, which begins about 30min after mixing. Importantly, as the extracts can be manipulated by the removal or addition of replication or cell cycle components, this provides an excellent opportunity to study pathways of activation and assembly of the replication machinery. Mammalian nuclei cannot be assembled from basic components in the same way, although it is possible to manipulate assembly of the replication machinery using permeabilised cells from the late G1 phase of the cell cycle mixed with extracts derived from S-phase cells.
References
Aten, J. A., Bakker, P. J., Stap, J., Boschman, G. A., and Veenhof, C. H. (1992). DNA double labelling with IdUrd and CldUrd for spatial and temporal analysis of cell proliferation and DNA replication. Histochem. J. 24, 251-259.
Chong, J. P. J., Th6mmes, P., Rowles, A., Mahbubani, H. M., and Blow, J. J. (1997). Characterisation of the Xenopus replication licensing system. Methods Enzymol. 283, 549-564.
Cremer, T., and Cremer, C. (2001). Chromosome territories, nuclear architecture and gene regulation in mammalian cells. Nature Rev. Genet. 2, 292-301.
Dolbeare, F. (1995). Bromodeoxyuridine: A diagnostic tool in biology and medicine. 1. Historical perspectives, histochemical methods and cell kinetics. Histochem. J. 27, 339-369.
Gratzner, H. G. (1982). Monoclonal antibody to 5-bromo and 5- iododeoxyuridine: A new reagent for detection of DNA replication. Science 218, 474-475.
Hozák, P., Hassan, A. B., Jackson, D. A., and Cook, P. R. (1993). Visualization of replication factories attached to a nucleoskeleton. Cell 73, 361-373.
Hozák, P., Jackson, D. A., and Cook, P. R. (1994). Replication factories and nuclear bodies: The ultrastructural characterization of replication sites during the cell cycle. J. Cell Sci. 107, 2191-2202.
Humbert, C., and Usson, Y. (1992). Eukaryotic DNA replication is a topographically ordered process. Cytometry 13, 603-614.
Jackson, D. A., and Cook, P. R. (1985). A general method for preparing chromatin containing intact DNA. EMBO J. 4, 913-918.
Jackson, D. A., and Pombo, A. (1998). Replicon clusters are stable units of chromosome structure: Evidence that nuclear organization contributes to the efficient activation and propagation of Sphase in human cells. J. Cell Biol. 140, 1285-1295.
Krude, T., Jackman, M., Pines, J., and Laskey, R. A. (1997). Cyclin/Cdk-dependent initiation of DNA replication in a human cell-free system. Cell 88, 109-119.
Leonhardt, H., Rahn, H. P., Weinzierl, P., Sporbert, A., Cremer, T., Zink, D., and Cardoso, M. C. (2000). Dynamics of DNA replication factories in living cells. J. Cell Biol. 149, 271-279.
Ma, H., Samarabandu, J., Devdhar, R. S., Acharya, R., Cheng, P. C., Meng, C. L., and Berezney, R. (1998). Spatial and temporal dynamics of DNA replication sites in mammalian cells. J. Cell Biol. 143, 1415-1425.
Manders, E. M. M., Kimura, H., and Cook, P. R. (1999). Direct imaging of DNA in living cells reveals the dynamics of chromosome formation. J. Cell Biol. 144, 813-821.
Nakamura, H., Morita, T., and Sato, C. (1986). Structural organisation of replicon domains during DNA synthesis phase in the mammalian nucleus. Exp. Cell Res. 165, 291-297.
Nakayasu, H., and Berezney, R. (1989). Mapping replication sites in the eukaryotic cell nucleus. J. Cell Biol. 108, 1-11.
O'Keefe, R. T., Henderson, S. C., and Spector, D. L. (1992). Dynamic organization of DNA replication in mammalian cell nuclei: Spatially and temporally defined replication of chromosome-specific ?-satellite sequences. J. Cell Biol. 116, 1095-1110.
Pepperkok, R., and Ansorge, W. (1995). Direct visualization of DNAreplication sites in living cells by microinjection of fluoresceinconjugated dUTPs. Methods Mol. Cell. Biol. 5, 112-117.
Schermelleh, L., Solovei, I., Zink, D., and Cremer, T. (2001). Twocolor fluorescence labeling of early and mid-to-late replicating chromatin in living cells. Chromosome Res. 9, 77-80.
Takebayashi, S. I., Manders, E. M. M., Kimura, H., Taguchi, H., and Okumura, K. (2001). Mapping sites where replication initiates in mammalian cells using DNA fibers. Exp. Cell Res. 271, 263- 268.
Zink, D., Cremer, T., Saffrich, R., Fischer, R., Trendelenburg, M. E, Ansorge, W., and Stelzer, E.H.K. (1998). Structure and dynamics of human interphase chromosome territories in vivo. Hum. Genet. 102, 241-251.
Support our developers


