Fluorescent Indicators for Imaging Protein Phosphorylation in Single Living Cells
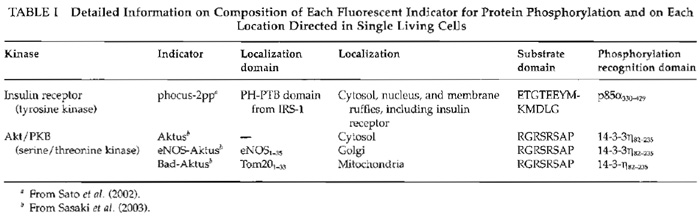
I. INTRODUCTIONTo study protein phosphorylation, investigators have used electrophoresis, immunocytochemistry, and in vitro kinase assays. However, these methods do not provide enough information about spatial and temporal dynamics of protein phosphorylation in each living cell. To overcome this limitation, we have developed genetically encoded novel fluorescent indicators and visualized signal transduction based on protein phosphorylation in living cells (Sato et al., 2002) (Fig. 1). Within the fluorescent indicator, a substrate domain for a protein kinase of interest is fused with a phosphorylation recognition domain via a flexible linker sequence. The tandem fusion unit consisting of the substrate domain, linker sequence, and phosphorylation recognition domain is sandwiched with two different color fluorescent proteins, cyan fluorescent protein (CFP) and yellow fluorescent protein (YFP), which serve as the donor and acceptor fluorophores for fluorescence resonance energy transfer (FRET). As a result of phosphorylation of the substrate domain and subsequent binding of the phosphorylated substrate domain with the adjacent phosphorylation recognition domain, FRET is induced from CFP to YFP when CFP is excited at 440 ± 10nm. Upon activation of phosphatases, the phosphorylated substrate domain is dephosphorylated and the FRET signal is decreased. This FRET change is represented by the change in the fluorescence emission ratio of CFP at 480 ± 15 nm and YFP at 535 ± 12.5 nm, both of which were monitored continuously by a dual-emission fluorescence microscope. We named this indicator "phocus" (a fluorescent indicator for protein phosphorylation that can be custom-made). Until now, by using suitable substrates and phosphorylation recognition domains, we have developed a large number of phocus variants for several key protein kinases, such as a receptor tyrosine kinase, insulin receptor, and a serine/threonine protein kinase, Akt/PKB (Table I). In addition, these phocus variants were further tailored to visualize subcellular local activity of the respective protein kinases in living cells (Table I). For example, the phocus variant for Akt protein kinase was tethered to the cytoplasmic surface of mitochondria or Golgi membranes by connecting each appropriate sequence/domain. This membrane tethering prevented the free diffusion of the indicator and avoided the resulting loss of spatial information as to phosphorylation by the activated Akt. We thus found that the activated Akt is not in the cytosol but is localized at subcellular membranes, including Golgi and mitochondria membranes, when the cells were stimulated.
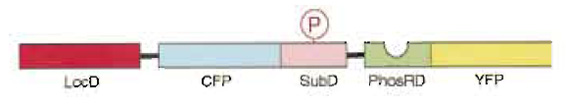 |
| FIGURE 1 Schematic representation of the present fluorescence indicator for protein phosphorylation, which was named phocus. Upon phosphorylation of the substrate domain within phocus by the protein kinase, the adjacent phosphorylation recognition domain binds with the phosphorylated substrate domain, which changes the efficiency of FRET between the GFP mutants within phocus. By tethering a localization domain with phocus, the phocus can be localized in the specific intracellular locus of interest to visualize the local phosphorylation event there. LocD, localization domain; CFP, cyan fluorescent protein; SubD, substrate domain; PhosRD, phosphorylation recognition domain; YFP, yellow fluorescent protein; P in an open circle, the phosphorylated residue. |
 |
II. MATERIALS AND INSTRUMENTATION
ECFP (Cat. No. 6900-1) and EYFP (Cat. No. 6006-1) expression vectors are from Clonthech. Ham's F-12 medium (Cat. No. 21700), fetal bovine serum (Cat. No. 10099-141), and LipofectAMINE 2000 (Cat. No. 11668- 019) reagent are from Invitrogen. Other chemicals used are all of analytical reagent grade. Glass-bottom dishes are from Asahi Techno Glass (Cat. No. 3911-035).
Cells are observed with a 40× oil-immersion objective (Carl Zeiss) on a Axiovert 135 microscope (Carl Zeiss) with a cooled CCD camera MicroMAX (Roper Scientific Inc.) controlled by MetaFluor (Universal Imaging). An excitation filter (440AF21), a dichroic mirror (455DRLP), and emission filters for CFP (480AF30) and YFP (535AF26) are from Omega Optical.
III. PROCEDURES
Solutions
- Culture medium: Add fetal bovine serum to Ham's F-12 medium to give a final concentration of 10%.
- Serum starvation medium: Add bovine serum albumin to Ham's F-12 medium to give a final concentration of 0.2%.
- Hank's balanced salt solution (HBSS): Dissolve 0.35 g of NaHCO3, 0.06 g of KH2PO4, 0.048 g of Na2HPO4, 0.14g of CaCl2, 0.40g of KCl, 0.10g of MgCl2·6H2O, 0.10g of MgSO4·7H2O, 8.00g of NaCl, and 1.00g of D-glucose in 800ml of Milli-Q water, adjust the pH to 7.4, and then adjust the volume to 1 liter.
Steps
- Plate CHO-IR cells that express human insulin receptor onto a glass-bottom dish with culture medium and incubate the cells at 37°C under 5% CO2 for 1 day.
- Transfect the cells with 0.8µg of cDNA (phocus- 2 or phocus-2pp) using Lippofecetamine 2000 reagent according to the manufacturer' s instructions.
- Incubate the cells at 37°C under 5% CO2 for 1 to 2 days.
- Replace the culture medium with serum starvation medium and incubate the cells at 37°C under 5% CO2 for 2 to 4 h.
- Replace the serum starvation medium with HBSS.
- Set the glass-bottom dish onto the 40x oil immersion objective equipped on the fluorescence microscope.
- Observe the cells with a 440-nm excitation filter (440AF21), 455-nm dichroic mirror (455DRLP), and 535-nm emission filter (535AF26).
- By browsing the cells on the dish, choose moderately bright cells in which the fluorescence is well distributed in the cytosol.
- Determine the desired observation field in which only the cells of interest are covered.
- Select several regions of interest within the cells to examine time courses of CFP/YFP emission ratio during the following image acquisition.
- Start to acquire images every 5 to 10s for 10 to 30min with the 440-nm excitation filter (CFP), 455-nm dichroic mirror, 480-nm emission filter (CFP), and 535-nm emission filter (YFP).
- During image acquisition, add insulin to give a final concentration of 100nM.
- After finishing all the experiments, wipe the residual immersion oil out of the objective.
IV. EXAMPLES
Substrates for protein kinases and phosphatases often exhibit each unique localization, including mitochondria, Golgi, nucleus, and plasma membrane in living cells, which is thought to be critical for specific signal transduction in the respective intracellular loci (Hunter, 2000). Thus, we further tailored our phocuses to analyze the phosphorylation events in such particular locations in single living cells. Here we exemplify phocus for insulin receptor and that for Akt/PKB; the latter was named Aktus.
A. Phocus for Imaging Phosphorylation by Insulin Receptor
IRS-1 is one of the major substrates of insulin receptor. It contains a peckstrin-homology (PH) domain and a phosphotyrosine-binding (PTB) domain in its Nterminal end. The PH and PTB domains bind, respectively, with the phosphoinositides at the plasma membrane and with the juxtamembrane domain of insulin receptor, which is immediately tyrosine phosphorylated by insulin stimulation (Paganon et al., 1999). Thus, the concentration of IRS-1 is thought to be increased around the insulin receptor at the plasma membrane upon insulin stimulation. These PH and PTB domains were fused with phocus, named phocus- 2pp, to locate the phocus around the insulin receptor like the IRS-1 and to measure the local phosphorylation event there. When phocus-2pp was expressed in CHO-IR cells, fluorescence was observed throughout the cells (Fig. 2, time 0s). Upon insulin stimulation, the CFP/YFP emission ratio, which is expressed with pseudocolor, was decreased in the cytosol due to phosphorylation-induced FRET from CFP to YFP within phocus-2pp. Three hundred seconds after insulin stimulation, membrane ruffles, in which a large extent of phocus-2pp were accumulated, appeared around the plasma and disappeared in 1000s (Fig. 2). In these membrane ruffles, phocus-2pp has been found to colocalize with the insulin receptor accumulated there by insulin stimulation. Interestingly, in these membrane ruffles, the extent of phocus-2pp phosphorylation was visualized to be ~2-fold greater than that in the cytosol. This difference in phosphorylation levels between intracellular loci could be due to a different balance of kinase and phosphatase activities between intracellular loci. Phocus-2pp should contribute to reveal the biological significance of such a characteristic domain for tyrosine kinase signaling in the membrane ruffles, which were formed upon insulin stimulation, with high spatial and temporal resolution.
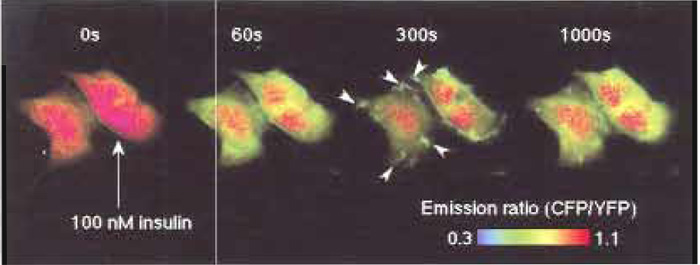 |
| FIGURE 2 Fluorescence imaging with phocus-2pp upon insulin stimulation. Pseudocolor images of the CFP/YFP emission ratio are shown before (time 0s) and 60, 300, and 1000s after the addition of 100nM insulin at 25°C, obtained from CHO-IR cells expressing phocus-2pp. Insulin-induced accumulation of phocus-2pp at the membrane ruffles is indicated by white arrows in the image at 300s. |
B. Aktus for Imaging Phosphorylation by Akt/PKB
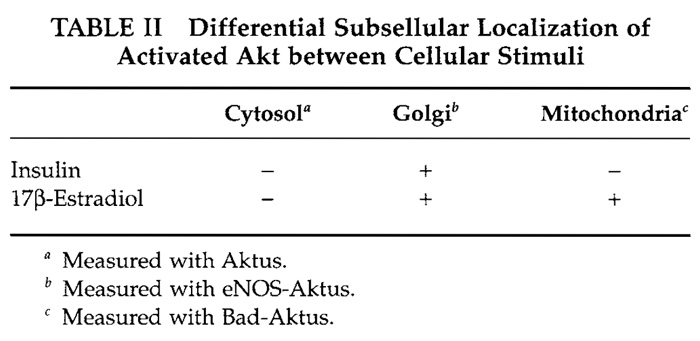
Akt/PKB is a serine/threonine kinase that regulates a variety of cellular responses, such as cell proliferation, cell survival, and angiogenesis (Marte and Downward, 1997). To provide information on the spatial and temporal dynamics of the Akt activity in single living cells, we have developed a genetically encoded fluorescent indicator for Akt, named Aktus (Sasaki et al., 2003). Almost all Akt substrates are localized to subcellular regions. For example, eNOS (Fulton et al., 2001), which mediates a vasodilatory effect by nitric oxide production, is localized predominantly to the Golgi apparatus, whereas Bad (Chao and Korsmeyer, 1998), which is related to apoptosis promotion, is present in mitochondrial outer membranes. By fusing the Aktus with the respectively subcellular localization domains within the eNOS and Bad, eNOSAktus and Bad-Aktus, which are respectively localized to the Golgi apparatus and mitochondrial outer membrane, were developed as shown in Table I and compared with the cytosolic diffusible indicator Aktus. We have shown that in vascular endothelial cells, the Golgi-localized indicator, eNOS-Aktus, was phosphorylated upon stimulation with insulin and with 17β- estradiol, whereas the mitochondria-localized Bad-Aktus was phosphorylated by 17β-estradiol but not by insulin (Table II). However, the diffusible indicator Aktus was not phosphorylated efficiently upon both insulin or 17β-estradiol stimulation (Table II). From these results, it is suggested that the activated Akt is localized to subcellular compartments, including the Golgi apparatus and/or mitochondria, rather than diffusing in the cytosol, thereby efficiently phosphorylating its substrate proteins. Different observation with the mitochondria-localized indicator indicates that localization of the activated Akt to mitochondria is directed differently between insulin and 17β-estradiol via distinct mechanisms. The present indicators and their applications are thus expected to contribute to the studies of a whole range of dynamics of the activated Akt in living cells.
 |
V. PITFALLS
- Avoid too bright cells to reproducibly obtain quantitative FRET signals. Also avoid too dim cells because they often exhibit noisy images.
- Our measurement conditions do not significantly affect the stability of phocus, but if photobleaching of fluorescent proteins, particularly YFP, is still observed, we recommend using ND filters and/or to irradiate the cells less. We usually irradiate the cell for 50 to 100 ms.
References
Chao, D. T., and Korsmeyer, S. J. (1998). Bcl-2 family: Regulators of cell death. Annu. Rev. Immunol. 16, 395-419.
Fulton, D., Gratton, J. P., and Sessa, W. C. (2001). Post-translational control of endothelial nitric oxide synthase: Why isn't calcium/calmodulin enough? J. Pharmacol. Exp. Ther. 299, 818-824.
Hunter, T. (2000). Signaling-2000 and beyond. 100, 113-127.
Marte, B. M., and Downward, J. (1997). PKB/Akt:connecting phosphoinositide 3-kinase to cell survival and beyond. Trends Biochem. Sci. 22, 355-358.
Paganon, S. D., Ottinger, E. D., Nolte, R. T., Eck, M. J., and Shoelson, S. E. (1999). Crystal structure of the pleckstrin homologyphosphotyrosine binding (PH-PTB) targeting region of insulin receptor substrate 1. Proc. Natl. Acad. Sci. USA 96, 8378-8383.
Sasaki, K., Sato, M., and Umezawa, Y. (2003). Fluorescent indicators for Akt/protein kinase B and dynamics of Akt activity visualized in living cells. J. Biol. Chem. 278, 30945-30951.
Sato, M., Ozawa, T., Inukai, K., Asano, T., and Umezawa, Y. (2002). Fluorescent indicators for imaging protein phosphorylation in single living cells. Nature Biotechnol. 20, 287-294.
Support our developers


