Cell Cycle Analysis by Flow and Laser-Scanning Cytometry
I. INTRODUCTIONThe cytometric methods for cell cycle analysis can be grouped into three categories. The first comprises methods that rely on a single time point ("snapshot") measurement of the cell population. This analysis may be either univariate, based on the measurement of cellular DNA content alone (Crissman and Hirons, 1994), or multivariate (multiparameter), when in addition to DNA content another cell attribute is measured (Darzynkiewicz et al., 1996; Endl et al., 2001; Larsen et al., 2001). The measured attribute is expected to provide information about a particular metabolic or molecular feature(s) of the cell that correlates with a rate of cell progression through the cycle or is a marker the cell proliferative potential or quiescence. While the single time measurement reveals the proportions of cells in G1 vs S vs G2/M, it provides no direct information on cell cycle kinetics. However, if duration of the cell cycle (or time of doubling of cells in the culture) is known, the length of G1, S, or G2/M phase can be estimated from the percentage of cells in the respective phase.
In the second category are methods that combine time-lapse measurements of populations of cells synchronized in the cycle or whose progression through the cycle was perturbed, e.g., halted by the agent arresting them at a specific point of the cycle. These methods reveal kinetics of cell progression through the cycle. A classical example of this group is the stathmokinetic approach where cells are arrested in mitosis, e.g., by vinblastine or colcemide, and the rate of cell entrance to mitosis ("cell birth" rate) is estimated from the slope representing a cumulative increase in the percentage of mitotic cells as a function of time of the arrest (Darzynkiewicz et al., 1987).
Methods of the third category rely on analysis of DNA replication concurrent with measurement of DNA content. They may be either single time point measurements or use the time-lapse strategy to measure cell cycle kinetics. Incorporation of the thymidine analogue and the S phase marker 5'- bromo-2'-deoxyuridine (BrdUrd) is detected either cytochemically, based on the use of DNA dyes such as Hoechst 33258, whose fluorescence is quenched by BrdUrd (Poot et al., 2002), or immunocytochemically using fluoresceinated BrdUrd antibodies (Dolbeare and Selden, 1994). Still another method of this category detects incorporated BrdUrd by the increased sensitivity of DNA to photolysis: utilizing terminal deoxynucleotidyl transferase, the photolytically generated strand breaks are then labeled with fluorochrome- tagged deoxynucleotides (Li et al., 1996). Because the latter method escapes the harsh conditions used to induce DNA denaturation (heat or acid), it is applicable in conjunction with immunocytochemical detection of intracellular proteins. The time-lapse measurements of the cohort of BrdUrd-labeled cells allows one to estimate their rate of progression through different points of the cell cycle (Terry and White, 2001).
The methods described in this article, representative of each of the three categories, can be applied both to cells measured by flow cytometry and to cells mounted on slides. The latter can be analyzed by laserscanning cytometer (LSC), the microscope-based cytofluorimeter that measures the fluorescence of individual cells deposited on slides rapidly, with sensitivity and accuracy comparable to that of flow cytometry (Kamentsky, 2001). One advantage of LSC is that the cells are stained and measured while attached to microscope slides. This eliminates cell loss that inevitably occurs due to repeated centrifugations during sample preparation for flow cytometry. Another advantage stems from the possibility of relocation of particular cells on slides for their visual inspection or morphometry, following the initial measurement of a large cell population and electronic selection (gating) of cells of interest. The instrument thus combines advantages of both flow and image cytometry.
Only a few selected methods are presented in this article. More detailed descriptions of these and other methods, their applicability to different cell systems, and advantages and limitations are provided elsewhere in books devoted specifically to the cell cycle (Gray and Darzynkiewicz, 1987; Fantes and Brooks, 1993; Studzinski, 1995, 1999) or flow cytometry (Darzynkiewicz et al., 1994, 2001; Gray et al., 1990).
II. MATERIALS AND INSTRUMENTATION
The materials listed for each of the different procedures can be purchased from the following sources: Triton X-100 (Cat. No. T 9284), Pipes (Cat. No. P 3768), RNase A (Cat. No. R 5000), and 5'-bromo-2'- deoxyuridine (Cat. No. B 5002) are from Sigma Chemical Co.; DAPI (4',6'-diamidino-2-phenylindole; Cat. No. D 1306), propidium iodide (PI, Cat. No. P-1304), and high-purity acridine orange (AO, Cat. No. A-1301) are from Molecular Probes; and methanol-free formaldehyde (Cat. No. 4018) is from Polysciences Inc.
The greatest selection of monoclonal and polyclonal antibodies applicable to cell cycle analysis is offered by DACO Corporation, Sigma Chemical Co., Upstate Biotechnology Incorporated, B.D. Biosciences PharMingen, and Santa Cruz Biotechnology, Inc.
A variety of models of flow cytometers of different makers can be used to measure cell fluorescence following staining according to the procedures listed in this article. The manufacturers of the most common flow cytometers are Becton Dickinson Immunocytometry Systems, Beckman/Coulter Inc., DACO/ Cytomation, and PARTEC GmbH. The multiparameter laser-scanning cytometer is manufactured by CompuCyte Corp.
The software used to deconvolute DNA content frequency histograms, to estimate the proportions of cells in the respective phases of the cycle, is available from Phoenix Flow Systems and Verity Software House.
III. PROCEDURES
A. Univariate Analysis of Cellular DNA Content
Progression through S phase and completion of mitosis (cytokinesis) result in changes in cellular DNA content. The cells position in the major phases (G0/1 vs S vs G2/M) of the cycle, therefore, can be estimated based on DNA content measurement. A variety of fluorochromes and numerous methods are used for DNA content analysis. A simple protocol, which can be modified to accommodate different dyes, has been developed and applied to numerous cell types.
1. Cell Staining with DAPI
Solution
Staining solution: Phosphate-buffered saline (PBS) containing 0.1% (v/v) Triton X-100 and 1Bg/ml DAPI (final concentrations)
Steps
- Suspend approximately 106 cells in 0.5 ml of PBS. Vortex gently (~3s) or gently aspirate several times with a Pasteur pipette to obtain a mono-dispersed cell suspension, with minimal cell aggregation.
- Fix cells by transferring this suspension, with a Pasteur pipette, into 12 × 75-mm centrifuge tubes containing 4.5ml of 70% ethanol on ice. Keep cells in ethanol for at least 2h at 4°C (cells may be stored in 70% ethanol at 4°C for weeks).
- Centrifuge the ethanol-suspended cells 3min at 200g. Decant thoroughly ethanol.
- Suspend the cell pellet in 5 ml of PBS, wait ~30 s, and centrifuge at 300g for 3 min.
- Suspend the cell pellet in 1 ml of DAPI staining solution. Keep in the dark, at room temperature, for 10min.
- Transfer sample to the flow cytometer and measure cell fluorescence. Maximum excitation of DAPI, bound to DNA, is at 359nm and emission is at 461 nm. For fluorescence excitation, use the available ultraviolet (UV) light laser line at the wavelength nearest to 359nm. When a mercury arc lamp serves as the excitation source, use a UG1 excitation filter. A combination of appropriate dichroic mirrors and emission filters should be used to measure cell fluorescence at wavelengths between 450 and 500nm.
- The data acquisition software of most flow cytometers/sorters allows one to record the fluorescence intensities (the integrated area of the electronic pulse signal) of 104 or more cells per sample. Data are presented as cellular DNA content frequency histograms (Fig. 1). The data analysis software packages (e.g., Rabinovitch, 1994) that deconvolute the frequency histograms to obtain percentage of cells in G0/1, S, and G2 + M are either included with the purchase of the flow cytometer or are available commercially from other vendors, as listed under Section II. For details of the methods of deconvolution of DNA content frequency histograms, see Rabinovitch (1994).
2. Staining with Propidium Iodide
If excitation with UV light is not possible, the procedure given earlier for DAPI can be modified to apply PI as the DNA fluorochrome. Thus, instead of DAPI, PI is included into the staining solution at a concentration of 10µg/ml. Because PI also stains doublestranded RNA, RNA is removed enzymatically during the staining reaction. This is accomplished by the addition of RNase A into the staining solution.
Solution
Staining solution: PBS containing 0.1% (v/v) Triton X-100, 10µg/ml of PI, and 100µ/ml of DNase-free RNase A.
Steps
- Suspend approximately 106 cells in 0.5 ml of PBS. Vortex gently (~3s) or gently aspirate several times with a Pasteur pipette to obtain a mono-dispersed cell suspension, with minimal cell aggregation.
- Fix cells by transferring this suspension, with a Pasteur pipette, into 12 × 75-mm centrifuge tubes containing 4.5ml of 70% ethanol on ice. Keep cells in ethanol for at least 2h at 4°C (cells may be stored in 70% ethanol at 4°C for weeks).
- Centrifuge the ethanol-suspended cells 3min at 200g. Decant thoroughly ethanol.
- Suspend the cell pellet in 5 ml of PBS, wait ~30 s, and centrifuge at 300g for 3 min.
- Suspend the cell pellet in 1 ml of PI staining solution. Keep in the dark, at room temperature, for 30 min or at 37°C for 10min.
- Transfer sample to the flow cytometer and measure cell fluorescence. Maximum excitation of PI, bound to DNA, is at 536nm and emission is at 617nm. Blue (488 nm) or green light lines of lasers are optimal for excitation of PI fluorescence. Emission is measured using the long-pass 600- or 610-nm filter. Data acquisition and analysis are as described earlier for DAPIstained cells.
Comments
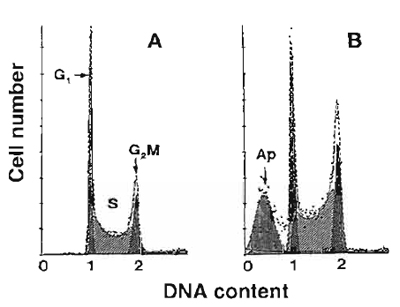 |
| FIGURE 1 Frequency distribution DNA content histograms of human leukemic HL-60 cells untreated (A) or treated with DNA topoisomerase II inhibitor fostriecin (B) and stained with PI as described in the text. The "multicycle" deconvolution program (Phoenix Flow Systems) has been used to identify and calculate percentage of cells with fractional DNA content (apoptotic cells; Ap) and cells in G1, S, and G2/M phases of the cycle content, as shown. The drug treatment caused an increase in the proportion of S and GaM cells and induced apoptosis. |
All cells in G1 have a uniform DNA content, as do cells in G2 and M; the latter have twice as much DNA as G1 cells. Under ideal conditions of DNA staining, the fluorescence intensities of all G1 or G2/M cells are expected to be uniform and, after analog to digital conversion of the electronic signal from the photomultiplier (representing their fluorescence intensity), to have uniform numerical values, respectively. In practice, however, G1 and G2 cell populations are represented on frequency histograms by peaks of various width. The coefficient of variation (cv) of the mean value of DNA-associated fluorescence of the G1 population (width of the peak) is a reflection of an accuracy of DNA content measurement and should not exceed 8%. Improper staining conditions, instrument missadjustment, and the presence of a large number of dead or broken cells all result in high cv of the G1 cell populations.
Apoptotic cells often have fractional DNA content due to the fact that the fragmented (low MW) DNA undergoes extraction during the staining procedure. Some cells may also lose DNA (chromatin) by shedding apoptotic bodies. Only a fraction of DNA thus remains within apoptotic cells. They are represented then on the DNA content frequency histograms by the "sub-G1l" peak (Fig.l). Commercially available software packages to deconvolute DNA histograms are able to identify and quantity the "sub-G1" cell population.
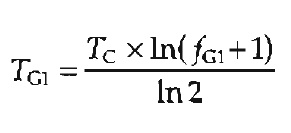
If the length of the cell cycle (or cell doubling time) is known, the duration of each of the phases can be estimated from the percentage (fraction) of cells in that phase. For example, during the exponential phase of cell growth, the duration of G1 (TG1) can be calculated from
 |
B. Multiparameter Analysis
Multiparameter analysis of other attributes of the cell, in addition to DNA content, allows one not only to distinguish cells in G1 vs S vs G2/M, but also to identify quiescent (G0) or mitotic cells. Thus, bivariate analysis of cell population with respect to their cellular DNA and RNA content discriminates between G0 and G1 cells. Bivariate analysis of DNA content and proliferation-associated proteins, particularly cyclins, provides another means to distinguish between proliferating and quiescent cells and yields additional information about the proliferative potential of cell populations (Darzynkiewicz et al., 1996). Immunocytochemical detection of histone H3 phosphorylation combined with DNA content analysis offers a convenient approach to distinguish M from G2 cells and to quantify the mitotic index in the cell population (Juan et al., 2001). This section presents examples of these methods.
1. Differential Staining of Cellular DNA and RNA
Quiescent (G0) cells are characterized by a manyfold lower RNA content compared to their cycling G1 counterparts (Darzynkiewicz et al.,1976). Simultaneous staining of RNA and DNA, therefore, allows one to distinguish G0 from G1 cells (based on differences in RNA content), as well as to identify cells in S and G2/M. Differential staining of cellular DNA and RNA can be accomplished with the metachromatic fluorochrome acridine orange (AO). At appropriate concentrations and ionic conditions AO intercalates into dsDNA and fluoresces green, while its interactions with RNA result in red fluorescence (Darzynkiewicz et al., 1994). Prior to staining with AO the cells are permeabilized with Triton X-100 in the presence of 0.08 M HCl and serum proteins. Such treatment makes cells permeable to AO, yet they are not lysed and their DNA and RNA content is preserved. Alternatively, the cells may be prefixed in 70% ethanol, as described previously for univariate DNA content analysis. Apoptotic cells stained under these conditions are characterized by markedly diminished DNA associated (green) AO fluorescence.
Solutions
- AO stock solution: Dissolve 1 mg AO in 1 ml of distilled water. This solution of AO is stable for several months when kept at 4°C in the dark (foil wrapped).
- First-step solution (solution A): Dissolve 0.1ml of Triton X-100 and 0.87g of NaCl in 92ml of distilled water. Add 8 ml of 1M HCl solution.
- Second-step solution (solution B): Prepare 100ml of the phosphate- citric acid buffer at pH 6.0 by combining 37 ml of 0.1M citric acid with 63 ml of Na2HPO4.. Add 0.87g of NaCl and 34mg EDTA, dissodium salt. Stir until dissolved. Add 0.6 ml of AO stock solution. This solution is stable for several months when kept at 4°C in the dark.
Steps
- Transfer a 0.2-ml aliquot of the cell suspension (<5 × 10⁵ cells) directly from tissue culture to a 2- or 5-ml tube.
- Gently add 0.4ml of ice-cold solution A. Wait 15s, keeping sample on ice.
- Gently add 1.2ml of ice-cold solution B. Keep
sample on ice prior the measurement.
NOTE 1 Vortexing, syringing, and vigorous mixing of cells when suspended in solution A or B break down the cells and should be avoided.
NOTE 2 As an alternative to detergent (Triton X-100) treatment, cells may be fixed in 70% ethanol as described for staining with DAPI (Section III, A,1). Carry out steps 1-4 of the DAPI staining protocol, suspend <105 cells in 0.2 ml of PBS, and follow with steps 2 and 3 as just described. - Measure cell fluorescence during the next 2-10min after the addition of solution B. Excite AO fluorescence with blue light (use 488- or 457-nm laser lines or BG12 excitation filter in the case of mercury lamp illumination). Measure the green fluorescence of AO bound to DNA at 530 ± 20nm and red fluorescence of AO bound to RNA at >640nm (long-pass filter).
Comments
A characteristic distribution of G0, G1, S, G2/M, and apoptotic cells, differing in RNA and DNA content, is shown in Fig. 2. The differences in RNA content enable G0 cells to be discriminated from G1 cells. However, the differences in DNA content provide the basis to identify apoptotic and nonapoptotic cells and, among the latter, to distinguish G0/1, S, and G2/M cell subpopulations.
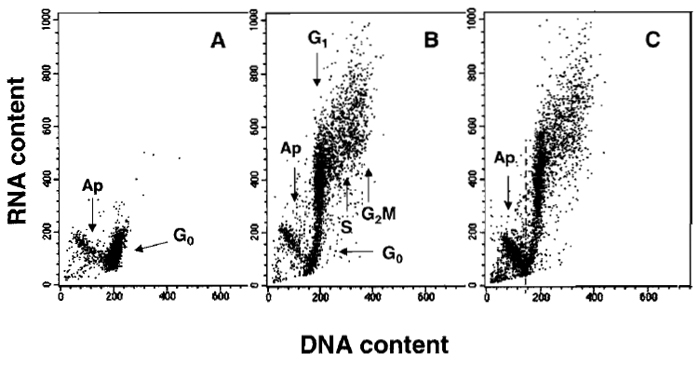 |
| FIGURE 2 Bivariate distributions (scatter plots) demonstrating differential staining of DNA and RNA with acridine orange (AO). Nonstimulated (A) and stimulated mitogenically with phytohemagglutinin (PHA) (B and C) lymphocytes were cultured for 48 h and then stained with AO according to the presented protocol. Nonstimulated G0 cells have minimal RNA content and uniform DNA content. During stimulation, a subset of lymphocytes undergoes apoptosis (Ap; activation-induced apoptosis), another subset enters cell cycle, while some cells remain in G0. All these subpopulations can be identified after differential staining of DNA and RNA: cells in G1 vs S vs G2/M differ in DNA content, whereas G0 cells are distinct from G1 cells due to differences in RNA content. The antitumor drug onconase was included in one of the PHA-treated cultures (C) to enhance "activation-induced apoptosis." The dashed line in C separates apoptotic from nonapoptotic cells. |
The major advantages of this assay are its simplicity, applicability to different instruments that use either laser or mercury lamp as a light source for fluorescence excitation, and the possibility it offers to distinguish G0 from G1 cells. Differential stainability of DNA vs RNA, however, requires very stringent conditions of cell staining in terms of dye concentration and ionic composition of the medium. AO also has a propensity to attach to sample flow lines of flow cytometers and therefore requires careful rinsing of the instrument with a bleaching solution (~15 min) to lower the background fluorescence for the subsequent analysis of weakly fluorescent samples. Further details of the AO methodology are presented elsewhere (Darzynkiewicz et al., 1994).
2. Cellular DNA Content and Expression of Proliferation-Associated Proteins
The expression of proliferation-associated proteins often varies during the cell cycle, as well as is different in cycling and quiescent cells. Their immunocytochemical detection, therefore, provides information on the proliferative status of the cell. The most common markers of proliferating cells are the proliferating cell nuclear antigen (PCNA) (Larsen et al., 2001), the antigen detected by the Ki-67 antibody (Endl et al., 2001) and certain cyclins (Darzynkiewicz et al., 1996).
Methods for detection of the proliferation associated proteins, particularly the choice of optimal fixative, may vary depending on the particular antigen (Jacobberger, 2001). The following method is applicable not only to cyclins (Darzynkiewicz et al., 1994, 1996), but also other intracellular antigens.
Solutions
- Fixatives: Methanol (see Comments)
- Cell permeabilizing solution: 0.25% Triton X-100, 0.1% sodium azide in PBS
- Rinsing solution: 1% bovine serum albumin (BSA), 0.1% sodium azide in PBS
Steps
- Prepare the fixative by filling 5-ml polypropylene tubes with 4.5ml of methanol (or 70% ethanol; see Comments). Keep tubes on ice.
- Suspend 1-2 × 10⁶ cells in 0.5 ml of PBS. Fix the cells by transferring this suspension with a Pasteur pipette into an ice-cold methanol tube. Keep cells in the fixative at -20°C at least overnight (cells can be stored in the fixative at -20°C for days).
- Centrifuge at 300 g for 3 min. Resuspend the cell pellet in 5 ml PBS. Keep at room temperature for 5 min. Spin at 200 g for 5 min.
- Resuspend cells in 0.5 ml of the permeabilizing solution. Keep at room temperature for 5min. Centrifuge as in step 3.
- Resuspend cell pellet in 100µ of the rinsing solution that contains the primary Ab. Follow instructions supplied by the vendor regarding the final titer of the supplied antibody (0.5-1.0 µg of the Ab per 106 cells suspended in 100 pl is generally optimal). Incubate for 60min at room temperature with gentle agitation or overnight at 4°C.
- Add 5ml of the rinsing solution. Centrifuge at 300 g for 5 min.
- Use the isotype immunoglobulin as a negative control. Process as in steps 5 and 6.
- Resuspend cells in 100 µl of rinsing solution that contains the fluoresceinated secondary Ab, generally at a final 1:20 to 1:40 dilution. Incubate at room temperature for 30-60min, agitating gently.
- Add 5 ml of the rinsing solution and centrifuge at 300g for 5 min.
- Suspend the cell pellet in 1 ml PBS containing 5µg/ml of PI and 100µg of DNase-free RNase A. Keep in the dark at room temperature for 1 h.
- Transfer cells to flow cytometer. Use blue light
(488-nm laser line) for fluorescence excitation. Measure
cell fluorescence in green (FITC, 530 ± 20 nm) and
red (PI, >620nm) light wavelengths.
NOTE If the primary Ab is fluorochrome tagged, skip step 8.
Comments
The critical steps for immunocytochemical detection of intracellular proteins are cell fixation and permeabilization. The fixative is expected to stabilize the antigen in situ and preserve its epitope in a state where it remains reactive with the Ab. The cells have to be permeable to allow the access of the Ab to the epitope. The choice of optimal fixative and permeabilizing agent varies, primarily depending on the intracellular antigen, less on the cell type. General strategies of cell fixation, permeabilization, and stoichiometry of antigen detection are discussed by Jacobberger (2001). Cold methanol appears to be optimal for the detection of D-type cyclins. For cyclins E, A, and B1, 70% cold ethanol is equally good.
Also critical is choice of a proper Ab. Often, the Ab applicable to immunoblotting fails in immunocytochemical application, and vice versa. This may be due to differences in the in situ accessibility of the epitope or differences in degree of denaturation of the antigen on the immunoblots compared to that within the cell. Some epitopes may not be accessible in situ at all, whereas the accessibility of others may vary depending on their functional state, e.g., due to phosphorylation or steric hindrance. Because there is strong homology between different cyclin types, crossreactivity may also be a problem. Because commercially available Abs may differ in specificity, degree of cross-reactivity, and so on, it is essential to provide detailed information (vendor and the hybridoma clone number) of the reagent used in the study.
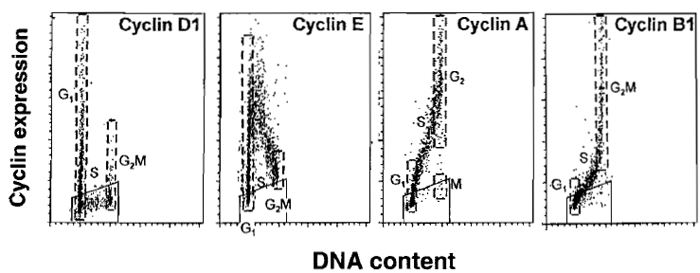 |
| FIGURE 3 Typical expression of cyclins D1, E, A, and B1 vs. DNA content as seen in normal, nontumor cells, processed as described in the text. Expression of cyclin D1 is shown in exponentially growing human normal fibroblasts. Expression of cyclins E, A, and B1 in PHA-stimulated human lymphocytes 48 h after administration of PHA. Boundaries of G1 and G2/M populations are marked by dashed lines. Trapezoid windows show the level of the unspecific, background, fluorescence measured separately using the isotypic irrelevant Ab. It is evident that cyclin D1 is expressed by a fraction of G1 cells; cells entering and progressing through S and most in G2/M cells are cyclin D1 negative. Cyclin E is maximally expressed by cells entering S phase and its level drops during progression through S. Cyclin A is expressed by S phase and maximally by G2 cells; mitotic cells (postprometaphase) are cyclin A negative. Cyclin B1 is expressed by late S cells, maximally in G2 and M. |
Cyclins are key components of the cell cycle progression machinery (Sheer, 2000). During unperturbed growth of normal cells the timing of expression of several cyclins, particularly cyclins D, E, A, and B, is discontinuous, occurring as discrete and well-defined periods of the cell cycle (Fig. 3). This periodicity in cyclins expression provides new cell cycle landmarks that can be used to subdivide the cell cycle into several subcompartments, additional to the subdivision of into four major phases (Darzynkiewicz et al., 1996). Furthermore, bivariate analysis of cyclins expression vs DNA content makes it possible to discriminate between cells having the same DNA content but residing in different phases of the cycle, such as between G2 and M cells (based on differences in cyclin A content), or between G2 diploid and G1 tetraploid cells (based on differences in expression of cyclins E and/or B1). Likewise, G0 cells lacking expression of D-type cyclins or cyclin E can be distinguished from cells that entered cell cycle and become cyclins D, and subsequently cyclin E, positive. Strategies for the use of cyclins as additional markers of the cell cycle position are discussed elsewhere (Darzynkiewicz et al., 1996). It should be noted, however, that some tumor cell lines, or normal cells when their cell cycle progression is perturbed, show unscheduled expression of cyclins D, E, and B1; namely G1 cyclins (e.g., cyclin E) are expressed during G2/M and the G2/M cyclins (cyclin B1) during G1 (Darzynkiewicz et al., 1996).
3. Identification of Mitotic Cells by Cytometry
There is often a need to estimate mitotic index, e.g., to assess effectiveness of the drugs that disrupt microtubules or in stathmokinetic experiment (Darzynkiewicz et al., 1987) to reveal the rate of cell entrance to mitosis. The cytometric methods used to identify mitotic cells are reviewed by Juan et al. (2001). The most convenient immunocytochemical method appears to be the one that utilizes Ab that is specific to histone H3 phosphorylated on Ser-l0 (H3-P), the event that occurs during mitosis (Juan et al., 2001). Because histone H3 is phosphorylated during prophase and is dephosphorylated late in telophase, the "time window" of detection of mitosis by this Ab spans these two mitotic stages. Histone H3-P-specific Abs are offered by Sigma Chemical Co. (monoclonal) and Upstate Biotechnology, Inc. (polyclonal). The methodology of cell staining and fluorescence measurement is similar to that described earlier for analysis of DNA content and proliferation-associated proteins. Optimal cell fixation, however, requires a brief (15min) pretreatment with 1% formaldehyde (in PBS, on ice) followed by postfixation in 70% ethanol. The results of fluorescence measurement are shown in Fig. 4.
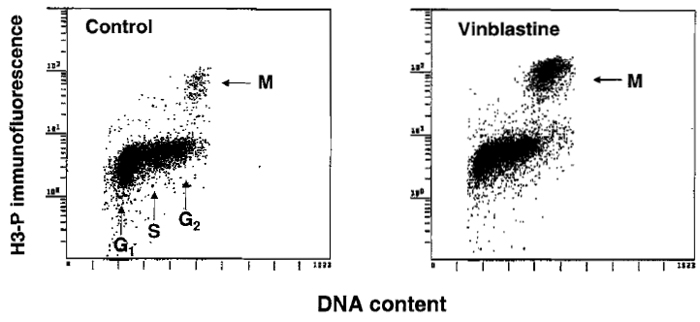 |
| FIGURE 4 Immunocytochemical identification of mitotic cells (M) using Ab that reacts with histone H3 phosphorylated on Ser-l0. To increase the proportion of mitotic cells, the culture shown at the right was treated for 4h with the metaphase-arresting agent vinblastine. |
C. Analysis of DNA Replication and Cell Cycle Kinetics
1. Stathmokinetic Approach
In a classical stathmokinetic experiment, the agent arresting cells in mitosis (e.g., colcemide or vinblastine) is added into the culture during the exponential phase of cell growth and the proportion of cells in mitosis is estimated as a function of the time of arrest. The slope of the plot representing an increase in the percentage of M cells during stathmokinesis reveals the rate of cell entry to M ("mitotic rate"; "cell birth rate").
Flow cytometric analysis of the stathmokinetic experiment can be based either on quantification of the increased proportions of cells in G2 + M, represented by the G2/M peak on the DNA content frequency histograms (by DNA content measurement followed by univariate data analysis), or by enumeration of cells in M (by selective staining of M cells, e.g., as shown in Fig. 4, followed by multivariate analysis of such data). Depletion of cells from the G1 compartment (G1 exit rate), as well as the rate of cell progression through S phase can also be measured during stathmokinesis (Darzynkiewicz et al., 1987). This section describes the scheme of a simple stathmokinetic in vitro experiment.
Solutions
Depending on the method used to stain DNA (Fig. 1) or detect mitotic cells (Fig. 4), appropriate solutions, as described earlier in the article, should be applied.
Steps
- To the exponentially and asynchronously growing cell culture add the stathmokinetic agent (e.g., colcemid, vinblastine, or nocodazole) at the concentration that arrests all cells entering mitosis and yet does not perturb the progression through other phases. Different cell types show different sensitivities to particular agents and pilot experiments testing various concentrations of the agents are often needed to estimate efficiency of the cell arrest. Vinblastine, at a final concentration of 50ng/ml, is quite effective in arresting most cell types of hematopoietic lineage in mitosis.
- Collect cells hourly, during a time interval equivalent to approximately one-third of the cell doubling time, and fix them in suspension.
- Use the flow cytometric staining techniques that allow either identification of cells in G1, S, and G2 + M (e.g., as in Fig. 1) or multiparameter analysis, which allows one to distinguish M cells (e.g., as in Fig. 4).
- Analyze data to obtain the percentage of cells in the respective phases of the cycle per each sample.
- Plot data as in Fig. 5. From the graphic display estimate the kinetic parameters, as shown in Fig. 5 and described in the legend. A more detailed analysis of the stathmokinetic experiment was presented elsewhere (Darzynkiewicz et al., 1987).
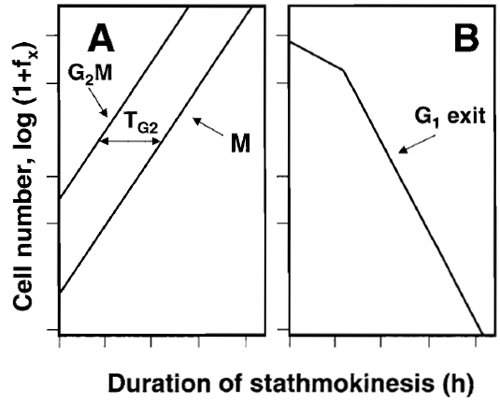 |
| FIGURE 5 The scheme of analysis of the stathmokinetic experiment.
Asynchronously and exponentially growing cell cultures were
treated with the metaphase-arresting stathmokinetic agent and subsequently
sampled to obtain percentage of cells in M or G2/M and
in G1 (e.g., as in Fig. 1 or 4). The percentage of cells in these phases (expressed as fraction of total; fx) at a given time point of mitotic arrest is then plotted as log (1 + fx). The slope representing the rate of entrance to M (or G2 + M) reveals duration of the cell cycle (Tc). The duration of G2 (TG2) is estimated as the time-distance of the G2 + M vs M slopes (A). Because of block of the cell cycle progression in M, the rates of emptying the G1 (G1 exit) can also be estimated (B). The stochastic component of the rate of cell exit from G1 manifests as the straight-line slope that reveals the half-time of cell residence in G1 (Darzynkiewicz et al., 1987). |
Comments
A major drawback of the methods based on single time point measurement is lack of kinetic information. These methods, thus, cannot distinguish whether cell cycle progression is accelerated, slowed down, or even halted, e.g., during drug treatment, if G1, S, and G2/M phases are affected proportionally to each other. The stathmokinetic approach can be used in such instances to reveal cell kinetics. The alternative method, namely cell synchronization followed by observation of the cycle progression of the synchronized cells cohort, is more complex and time-consuming.
2. BrdUrd Incorporation
Incubation of cells in medium containing BrdUrd results in its incorporation during DNA replication (S phase). The incorporated BrdUrd can be detected either cytochemically, by virtue of its propensity to quench the fluorescence of several DNA fluorochromes such as Hoechst 33358 or AO, or immunocytochemically using poly- or monoclonal Abs against this precursor.
Continuous or pulse-chase cell labeling with BrdUrd, followed by detection of BrdUrd simultaneously with measurement of cellular DNA content and bivariate data analysis (Dolbeare et al., 1983; Terry and White, 2001), allows one to estimate a variety of cell cycle parameters. The protocol of Dolbeare et al., (1983), with more recent modifications (Gray et al., 1990), is given here. DNA denaturation by acid (HCl) gives more satisfactory results in some cell types.
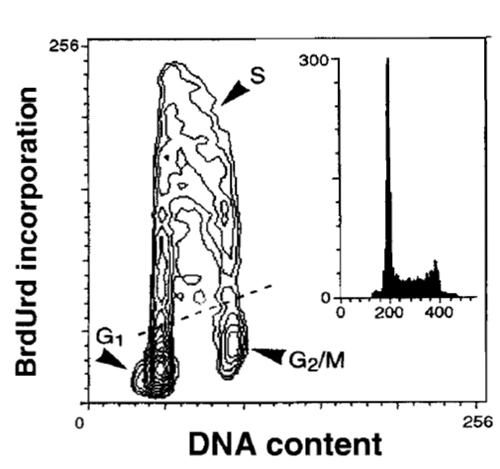 |
| FIGURE 6 Bivariate distribution of cellular DNA content and BrdUrd incorporation. HL-60 cells were incubated with BrdUrd for 30min, fixed, DNA was denatured by 2M HCl, the incorporated BrdUrd was detected by the monoclonal antibody, and DNA was counterstained with PI, as described in the text. |
a. Thermal Denaturation of DNA
Solutions
- DNA denaturation buffer: 0.1mM Na-EDTA in 1 mM Na-cacodylate; final pH 6.0
- Diluting buffer: PBS containing 0.1% Triton X-100 and 0.5% bovine serum albumin (BSA)
Steps
- Incubate cells with 10-30µg/ml of BrdUrd under light-proof conditions.
- Fix cells in suspension in 70% ethanol.
- Centrifuge cells (1-2 × 10⁶) at 200 g for 3 min, resuspend cell pellet in 1 ml of diluting buffer containing 100µg/ml of RNase A, and incubate at 37°C for 30 min.
- Centrifuge cells (300g, 3min) and suspend cell pellet in 1 ml of ice-cold 0.1M HCl containing 0.1% Triton X-100. After 1 min, centrifuge cells again. Drain thoroughly and resuspend in 5 ml of DNA denaturation buffer.
- Centrifuge cells again and resuspend cell pellet in 1 ml of DNA denaturation buffer.
- Heat cells at 90 or 95°C for 5 min and then place on ice for 5 min.
- Add 5 ml of diluting buffer. Centrifuge (300g).
- Drain well and suspend cells in 100µl of BrdUrd Ab, dissolved in diluting buffer, for 30min at room temperature (follow the instructions provided by the supplier regarding the dilution, time, and temperature of incubation with anti-BrdUrd).
- Add 5 ml of dilution buffer and centrifuge.
- Suspend cells in 100µl of FITC-labeled goat antimouse IgG (dissolved in diluting buffer) and incubate for 30min at room temperature.
- Add 5ml of diluting buffer, centrifuge, drain, and resuspend in 1 ml of this buffer containing 5 µg/ml of PI.
- Measure the BrdUrd-associated green fluorescence
and DNA-associated red fluorescence as described
earlier in procedure B2.
NOTE: If the primary Ab is fluorochrome-tagged, skip step 10.
b. Denaturation of DNA by HCl
Solution
Diluting buffer: same as for thermal denaturation of DNA
Steps
- Follow steps 1-4 as described earlier for thermal denaturation of DNA.
- Centrifuge cells (300g, 3min) and resuspend cell pellet in 1 ml of 2M HCl. After 20min at room temperature, add 5 ml of HBSS, centrifuge, and drain well. Resuspend cells in 5ml of 0.2M phosphate buffer at pH 7.4 to neutralize traces of the remaining HCl.
- Centrifuge cells at 300g
- Follow steps 8-12 as described earlier for thermal denaturation of DNA.
Comments
The critical step in this procedure is induction of partial DNA denaturation. This step often results in cell damage and leads to significant cell loss. Use of silinized tubes during centrifugations may decrease cell loss. Also, there are differences in sensitivity of DNA to denaturation between cell types, depending on their chromatin structure. Thus, while induction of DNA denaturation by acid may prove to be satisfactory with one cell type, it may fail with another. Some cell types require higher acid concentration (4M) for optimal results.
The alternative approach is based on selective photolysis of DNA that contains the incorporated BrdUrd followed by DNA strand break labeling (Li et al., 1996). Because no heat or acid treatment is required, the latter procedure is applicable in combination with immunocytochemical analysis.
The scope of this article makes it impossible to describe all possibilities of analysis of the cell cycle based on BrdUrd incorporation, either after the pulsechase or continuous cell labeling. Readers are advised to consult Dolbeare and Selden (1994) and Terry and White (2001) for a more detailed description of these methods.
IV. CELL ANALYSIS BY LASER.SCANNING CYTOMETER
All the methods described earlier can be adapted to stain cells mounted on microscope slides, to be analyzed by the multiparameter (three-laser excitation, four-color fluorescence detection) LSC (Darzynkiewicz et al., 1999; Kamentsky, 2001). To be analyzed by LSC the cells are attached to the slides electrostatically or by cytospinning, fixed, rinsed and then subjected to the procedures as presented earlier. To attach cells by cytospinning, 300µl of cell suspension in tissue culture medium (with serum) containing approximately 20,000 is added to a cytospin chamber. The cells are then cytocentrifuged at 1000 rpm for 6 min and are submerged in the respective fixative in Coplin jars.
Small volumes of the respective buffers, rinses, or staining solutions as described for each of the methods in this article, are carefully layered on the cytospin area of the horizontally placed slides. At appropriate times these solutions are removed with a Pasteur pipette (or vacuum suction pipette). Small pieces (1 × 1 cm) of thin polyethylene or Parafilm foil may be layered on slides atop of the drops of the solutions used for cell incubations, over the cytospins, to prevent drying. The incubations should be carried out in a moist atmosphere.
At the final step of each particular staining procedure the cells are mounted in a drop of the respective staining solution, made identical as for flow cytometry, under the coverslip. The coverslips may be sealed with melted paraffin or a gelatin-based sealer. The cell fluorescence is measured by LSC, and the choice of the fluorescence excitation wavelength and emission filters is the same as described earlier for flow cytometers.
V. LIMITATIONS AND PITFALLS
- Each approach has different type of limitations and possible pitfalls. The most frequent pitfall in univariate cell cycle analysis is lack in accuracy of DNA content measurement. As noted earlier, the accuracy is expressed as cv of the mean DNA content of G1 cells. The results are unacceptable if the cv is larger than 8%; optimally, cv should be below 2%. Inappropriate adjustment of optics and fluidics of the flow cytometer are the most common causes of inaccuracy of DNA content analysis.
- Common pitfalls in analysis of proliferationassociated antigens are due to inappropriate cell fixation and inappropriate choice of the antibody. Pilot experiments, testing different fixatives, different means of cell permeabilization, and different titer of the antibody, should be performed in the case of each new antigen. Many monoclonal antibodies that are available commercially have been developed to denatured proteins may not be applicable for immunocytochemistry. Although the isotypic IgG is commonly used as a negative control, some IgG preparations may show reactivity to various cell constituents. The optimal negative control is the same cell line having gene coding for the studied protein deleted, if available.
- In the case of BrdUrd techniques, the unpredictable variable that affects cell stainability is variation in chromatin structure between different cell types. Hence, the methods should often be optimalized for a particular cell type by testing different temperatures of DNA denaturation (80-100°C) or different strength of HCl used to induce DNA denaturation (1-4M).
Acknowledgment
Supported by NCI RO1 96 704. Dr. Gloria Juan is currently at the Sloan-Kettering Cancer Institute, New York. Dr. P. Pozarowski is on leave from the Department of Immunology, School of Medicine, Lublin, Poland.
References
Bauer, K. D., and Jacobberger, J. (1994). Analysis of intracellular proteins. Methods Cell Biol. 41, 352-376.
Crissman, H. A., and Hirons, G. T. (1994). Staining of DNA in live and fixed cells. Methods Cell Biol. 41, 196-209.
Darzynkiewicz, Z., Crissman, H. A., and Robinson, J. P. (eds.) (2001). Methods Cell Biol. 63 and 64.
Darzynkiewicz, Z., Gong, J., Juan, G., Ardelt, B., and Traganos, E (1996). Cytometry of cyclin proteins. Cytometry 25, 1-13.
Darzynkiewicz, Z., Gong, J., and Traganos, E (1994). Analysis of DNA content and cyclin protein expression in studies of DNA ploidy, growth fraction, lymphocyte stimulation and cell cycle. Methods Cell Biol. 41, 422-436.
Darzynkiewicz, Z., Robinson, J. P., and Crissman, H. A. (eds.) (1994). Methods Cell Biol. 41 and 42.
Darzynkiewicz, Z., Traganos, E, and Kimmel, M. (1987). Assay of cell cycle kinetics by multivariate flow cytometry using the principle of stathmokinesis. In "Techniques in Cell Cycle Analysis" (J. W. Gray and Z. Darzynkiewicz, eds.), pp. 291-336. Humana Press, Clifton, NJ.
Darzynkiewicz, Z., Traganos, E, Sharpless, T., and Melamed, M. R. (1976). Lymphocyte stimulation: A rapid multiparameter analysis. Proc. Natl. Acad. Sci. USA 73, 2881-2884.
Dolbeare, E, and Selden, J. L. (1994). Immunochemical quantitation of bromodeoxyuridine: Application to cell kinetics. Methods Cell Biol. 41, 298-316.
Endl, E., Hollmann, C., and Gerdes, J. (2001). Antibodies against the Ki-67 protein: Assessment of the growth fraction and tools for cell cycle analysis. Methods Cell Biol. 63, 399-418.
Fantes, P., and Brooks, R. (eds.) (1993). "The Cell Cycle: A Practical Approach." Oxford Univ. Press, Oxford.
Gray, J. W., and Darzynkiewicz, Z. (eds.) (1987). "Techniques in Cell Cycle Analysis." Humana Press, Clifton, NJ.
Gray, J. W., Dolbeare, E, and Pallavicini, M. G. (1990). Quantitative cell cycle analysis. In "Flow Cytometry and Sorting" (M. R. Melamed., T. Lindmo, and M. L. Mendelsohn, eds.), pp. 445-467. Wiley-Liss, New York.
Jacobberger, J. M. (2001). Stoichiometry of immunocytochemical staining reactions. Methods Cell Biol. 63, 271-298.
Juan, G., Traganos, E, and Darzynkiewicz, Z. (2001). Methods to identify mitotic cells by flow cytometry. Methods Cell Biol. 63, 343-354.
Kamentsky, L. A. (2001). Laser scanning cytometry. Methods Cell Biol. 41, 51-88.
Larsen, J. K., Landberg, G., and Roos, G. (2001). Detection of proliferating cell nuclear antigen. Methods Cell Biol. 63, 419-431.
Li, X., Melamed, M. R., and Darzynkiewicz, Z. (1996). Detection of apoptosis and DNA replication by differential labeling of DNA strand breaks with fluorochromes of different colon Exp. Cell Res. 222, 28-37.
Poot, M., Silber, J. R., and Rabinovitch, P. S. (2002). A novel flow cytometric technique for drug cytotoxicity gives results comparable to colony-forming assays. Cytometry 48, 1-5.
Rabinovitch, P. S. (1994). DNA content histogram and cell cycle analysis. Methods Cell Biol. 41, 364-387.
Sheer, C. J. (2001). The Pezcoller lecture: Cancer cell cycles revisited. Cancer Res. 60, 3689-3695.
Studzinski, G. P. (1995). "Cell Growth and Apoptosis: A Practical Approach." Oxford Univ. Press, Oxford.
Studzinski, G. P. (1999). "Cell Growth, Differentiation and Senescence: A Practical Approach." Oxford Univ. Press, Oxford.
Terry, N. H. A., and White, R. A. (2001). Cell cycle kinetics estimated by analysis of bromodeoxyuridine incorporation. Methods Cell Biol. 63, 355-374.
Support our developers


