Ca2+ as a Second Messenger: New Reporters for Calcium (Cameleons and Camgaroos)
I. INTRODUCTIONThe intracellular Ca2+ ion concentration has been found to be associated with a wide variety of cellular processes (Carafoli, 2003). These include diverse events such as secretion, fertilization, cleavage, nuclear envelope breakdown, and apoptosis. Several diseases, including types of muscular dystrophy, diabetes, and leukemia, involve proteins that directly respond to or control Ca2+. Indeed, it may be more difficult to find cellular processes that do not involve Ca2+ than ones that do. From decades of research we have learned that the process of Ca2+ signaling consists, in general terms, of molecules for Ca2+ signal production, spatial and temporal shaping, sensors, and targets that elicit changes in biological function. Hence, this has prompted the development of sensitive signaling techniques to measure and image submicromolar levels of [Ca2+] and decode the dynamic Ca2+ messages throughout the propagation of the signal.
Ca2+ transients have traditionally been measured using synthetic fluorescent chelators (such as Fura-2 and Quin2) or recombinant aequorin (Grynkiewicz et al., 1985: Montero et al., 1995). Synthetic molecules provide a bright fluorescent signal, but these dyes are not easy to load and gradually leak out of cells at physiological temperatures. Cellular targeting is also not specific and some chemical indicators have been shown not to accumulate well in certain organelles. Aequorin is targeted easily but it requires incorporation of the cofactor coelenterazine, is irreversibly consumed by Ca2+, and is very difficult to image due to low bioluminescence. By comparison, green fluorescent protein (GFP) and calmodulin (CaM)-based "cameleon" probes have been developed and retain several of the benefits of the aforementioned indicators, yet also provide significant improvements for in vivo imaging (Miyawaki, 2003; Zhang et al., 2002; Truong and Ikura, 2001).
The use of cameleon indicators is gradually becoming more common within the Ca2+ signaling community and the literature is rich with examples of various applications. For instance, fusion of cameleons to specific signal sequences has successfully sorted them to nuclei, endoplasmic reticulum, caveolae, and secretory granule membranes (Isshiki et al., 2002; Demaurex and Frieden, 2003; Emmanouilidou et al., 1999). In addition to their use in detecting rapid stimulusinduced [Ca2+] transients, genetic studies in which cameleons were stably expressed in Arabidopsis stomatal guard cells (Allen et al., 1999), nematode pharyngeal muscle (Kerr et al., 2000), or larval thermoresponsive neurons of Drosophila (Liu et al., 2003) show that the sensors are also applicable to long-term monitoring of Ca2+ concentration. This has been demonstrated further for murine cells where the circadian rhythm of cytosolic but not nuclear Ca2+ in hypothalmic suprachiasmatic neurons was demonstrated (Ikeda et al., 2003).
It is hoped that this article provides some explicit and practical information relevant to the laboratory use of cameleon fluorescence resonance energy transfer (FRET) indicators. Our aim is that it will benefit and be of interest to colleagues both unfamiliar or experienced in using fluorescent Ca2+ indicators.
II. MATERIALS AND INSTRUMENTATION
A. Expression and Purification of Cameleons
Enhanced cyan fluorescent protein (ECFP) and enhanced yellow fluorescent protein (EYFP) expression constructus (Clontech Cat. No. 6075-1 and 6004-1, respectively); calmodulin cDNA (M. Ikura); pRSETB prokaryotic expression vector (Invitrogen Cat. No. V351-20); Luria broth (LB) media; isopropyl-β-D-thiogalactopyranoside (IPTG, Fermentas Cat. No. R0391); complete protease inhibitor cocktail tablets (Roche Cat. No. 1697498); Ni-NTA agarose (Qiagen Cat. No. 1018240); Escherichia coli BL21 (DE3) strain (Stratagene Cat. No. 200133); sonicator; EGTA buffer: 100 mM KCl, 50 mM HEPES (pH 7.4), and 10 mM EGTA; CaCl2 buffer: 100 mM KCl, 50 mM HEPES (pH 7.4), 10 mM EGTA, and 10 mM CaCl2.
B. In Vitro Fluorescence Quantitation
Shimadzu spectrofluorometer RF5301; 10-mm pathlength quartz cuvette.
C. In Vitro Imaging of Cameleons
pcDNA3 eukaryotic transient expression vector (Invitrogen Cat. No. V790-20); uncoated; γ-irradiated, 35-mm tissue culture dishes with glass bottom No. 0 (MatTek Cat. No. P35G-0-10-C); Dulbecco's modified Eagle medium (DMEM) supplemented with 10% dialyzed fetal bovine serum (FBS, Invitrogen Cat. No. 26400044), Hanks' balanced salts solution (HBSS) with Ca2+ (Invitrogen Cat. No. 14170120); 37°C CO2 incubator; HeLa cells or appropriate eukaryotic strain; Lipofectamine (Invitrogen Cat. No. 18324012) and PLUS (Invitrogen Cat. No. 11514015) reagents; histamine, ionomycin, ethylene glycol-bis(2-aminoethylether)-N,N,N',N'-tetraacetic acid (EGTA) and 1,2-bis(2-aminophenoxy)ethane-N,N,N',N'-tetraacetic acid tetrakis(acetoxymethyl ester) (BAPTA-AM) (Sigma Cat. No. H7125, I0634, E0396, and A1076, respectively); Olympus IX70 inverted epifluorescence microscope; Olympus Xenon lamp; MicroMax 1300YHS CCD camera and Sutter Lambda 10-2 filter changers controlled by Metafluor 4.5r2 software (Universal Imaging); ECFP-EYFP FRET filter set (Omega Optical); 440AF21 excitation filter (ECFP excitation), 455DRLP dichroic mirror, 480AF30 emission filter (ECFP emission), and 535AF26 emission filter (EYFP emission); neutral density (ND) filter set (Omega Optical); UApo 40xOil Iris/340 objective (Olympus); U-MNIBA bandpass mirror cube unit (Olympus).
III. PROCEDURES
A. Engineering Cameleon Constructs
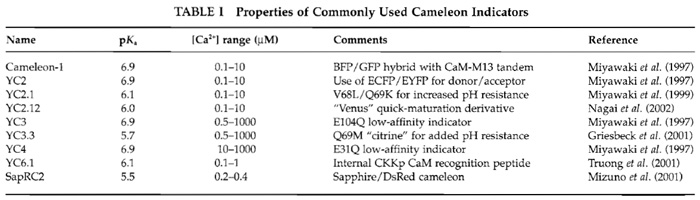
The history of cameleon engineering is reflected in its nomenclature (Table I). Optimization of Ca2+ affinities, pH dependency, maturation time, and other parameters is by no means complete. However, we present construction of a general cameleon designed in our laboratory, YC6.1, to serve as a reference point for future work (Truong et al., 2001). Molecular biology techniques for manipulating recombinant DNA are not given as they can be obtained from common reference books.
 |
![FIGURE 1 Schematic depiction of YC6.1 FRET in response to [Ca2+]. See text for details.](images/v2_pb_s08_c40_f01.jpg) |
| FIGURE 1 Schematic depiction of YC6.1 FRET in response to [Ca2+]. See text for details. |
In these constructs, ECFP and EYFP function as a donor-acceptor pair for nonradiative, intramolecular FRET. During FRET, excitation of the donor (cyan) leads to emission from the acceptor (yellow), provided that the molecules are close enough (within 80 Å) and in a parallel orientation. In this way, on binding Ca2+ the CaM wraps around its adjacent CKKp target peptide and ECFP and EYFP are brought closer to each other and FRET increases (Fig. 1).
- A successful construction of GFP-fused protein indicators is facilitated greatly by careful inspection of available three-dimensional structure information of the protein or protein domain used for sensing functions. Typically, such structural analysis can be done using SwissPDBviewer (Windows) and MODELLER (Unix), which allow the measurement of atomic distances and the molecular modeling of fusion proteins, respectively. This was also the case for designing YC6.1. We found that by virtue of the hairpin-like complex structure of CKKp, the peptide can be inserted into the domain linker region (residues 78-81) of CaM.
- Insert a CaM-binding peptide derived from CaM-dependent protein kinase kinase (CKKp; residues 438-463) between the terminal EF hand Ca2+- binding domains (N-CaM and C-CaM) within the CaM linker domain (between CaM residues 79 and 80) and connect via two Gly-Gly linkers.
- Add ECFP- and EYFP-encoding open reading frames to termini of the (N-CaM)-GG-CKKp-GG-(CCaM) module by recombinant DNA methods. Expression vectors for many GFP family members are available through Clontech. Cameleon constructs can benefit from truncation of the last 11 C-terminal amino acids of ECFP (the minimal region to form GFP) to reduce the relative tumbling of the fluorophores. Additionally, linkers introduced between CaM domains and the target peptide can be optimized for complex formation.
- Sequence construct to ensure polymerase chain reaction errors are not present. Note that oligonucleotides designed to the 5' or 3' end of ECFP open reading frames will also recognize the counterpart sequences in EYFP due to high sequence identity.
- Subclone this cameleon domain into either pRSETB plasmid, for prokaryotic protein expression sufficient for biochemical and biophysical characterization, or pcDNA3.1 for mammalian expression and in vivo Ca2+-imaging experiments. If optimal expression is not crucial, we also found that the pTriEx3 (Novagen) vector is convenient for expression in both prokaryotic and eukaryotic systems.
- In addition to this cytoplasmic version of cameleon YC6.1, nucleus- and endoplasmic reticulumtargeted versions (YC6.1nu and YC6.2er, respectively) can be constructed by the addition of appropriate signal sequences to termini.
B. Overexpression and Purification of Cameleons
- From a single colony of newly transformed E. coli strain BL21(DE3), grow liquid cultures at 37°C in LB medium containing 100µg/ml ampicillin.
- At OD600, induce cultures with 0.5mM IPTG at 15°C overnight.
- Harvest cells by centrifugation at 6500rpm for 20min at 4°C.
- Resuspend cell pellets in 1/20 culture volume of lysis buffer [50mM HEPES (pH 7.4), 10% glycerol, 100 mM KCl, 1 mM CaCI2, and 1 mM phenylmethyl sulfonyl fluoride (PMSF)], sonicate, and centrifuge at 15,000rpm for 30min to remove debris.
- Incubate the supernatant with nickel chelate agarose for 1 h at 4°C and wash with of 50mM HEPES (pH 7.4), 100mM KCl, and 5 mM imidazole.
- Elute YC6.1 with 300mM imidazole in the aforementioned buffer. Proteolytic cleavage to remove the (His)6 tag is not necessary as it does not interfere with YC6.1 fluorescent properties.
- Optional: The eluant can be then purified further on a Superdex 75 HR 10/30 FPLC column using 20 mM HEPES, pH 7.5, 150 mM KCl, 5% glycerol, 5 mM dithiothreitol, and 1 mM PMSE
- Use the fraction that has the highest FRET ratio for fluorescence experiments.
- Dialyze the sample against 2 liter of 50 mM HEPES (pH 7.4), 100 mM KCl at 4°C.
- Optional: Glycerol can be added to the sample at a final concentration of 20%, and aliquot, flash freeze in liquid N2, and store the YC6.1 at -70°C.
If necessary, it is possible to perform the characterization using a mammalian cell lysate. For harvesting, cells should be transfected in several 100-mmdiameter culture dishes, washed thoroughly to remove traces of phenol red and serum, and lysed in a hypotonic lysis buffer [50 mM HEPES (pH 7.4) 100 mM KCl, 5mM MgCl2, and 0.5% Triton X-100]. Following removal of cellular debris by centrifugation, dialyze the supernatant in 2 liter of buffer [50 mM HEPES (pH 7.4) and 100mM KCl]. Finally, the sample can be used for characterization as described.
C. In Vitro Cameleon Fluorescence Spectroscopy
- Record fluorescence spectra on a Shimadzu spectrofluorometer RF5301 using a 10-mm path-length quartz cuvette at room temperature.
- Dilute cameleon chimeric proteins in 50mM HEPES (pH 7.4), 100mM KCl, and 20µM EGTA to a final concentration of 60nM. Although many dilution factors are acceptable, intermolecular ECFP-EYFP FRET will occur at higher concentrations, thereby inflating the emission signal falsely.
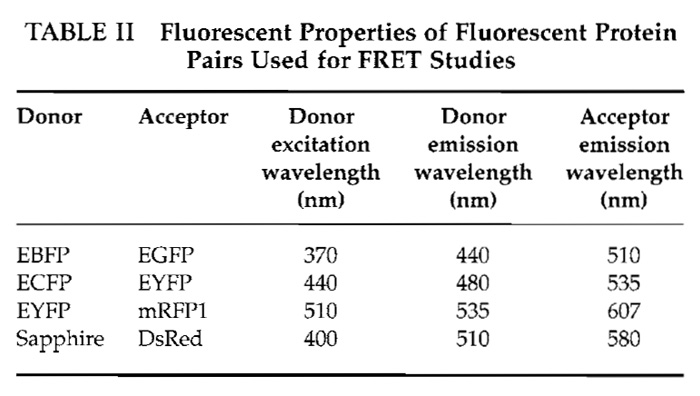
- Excitate at 433 nm and monitor the fluorescence emission between 450 and 570nm with excitation and emission slit widths of 5 nm (Table II).
- Record the fluorescence emission spectra of buffer (background) and cameleon protein solutions.
- Subtract the background spectrum for buffer alone from the cameleon sample to find spectra of the cameleon in the absence of Ca2+.
- Determine the fluorescence emission ratio (R) by dividing the integration of fluorescence intensities of the FRET acceptor (for EYFP, between 520 and 536 nm) by that of the FRET donor (for ECP, between 470 and 485 nm).
- Determine Rmin from this spectrum. A key parameter for a Ca2+ indicator is its dynamic range in response to [Ca2+]. The dynamic range of a cameleon is defined as the division of the maximum ratio, Rmax, by the minimum ratio, Rmin.
- In the presence of 1 mM CaCl2, repeat to find spectra of the cameleon in the presence of saturating amounts of Ca2+. Determine Rmax from this spectrum.
 |
The Ca2+-binding curve is used to assess the effective range of [Ca2+] measurement. Ca2+/EDTA and Ca2+/EGTA buffers are used as standards because even trace Ca2+ contaminants can significantly distort [Ca2+]free values at low [Ca2+] (Bers et al., 1994; Miyawaki et al., 1997).
- Prepare EGTA buffer [100 mM KCl, 50 mM HEPES (pH 7.4), 10mM EGTA] and CaCl2 buffer [100mM KCl, 50mM HEPES (pH 7.4), 10mM EGTA, 10 mM CaCl2]. pH should be held constant.
- Use a 1-ml cuvette and dilute the sample in the EGTA buffer. Record the fluorescence emission spectrum from 450 to 570nm at 433-nm excitation. Determine the emission ratio.
- To obtain the Ca2+-binding curve, add successive fractions of the CaCl2 solution to the sample and determine the emission ratio. Given that the experiment is performed in 20°C with these EGTA and CaCl2 buffers, the free calcium can be calculated by solving the quadratic equation: [Ca2+]free2 + (10,000,060.5- [Ca2+]total) * [Ca2+]free - 60.5 * [Ca2+]total = 0.
- To produce the Ca2+-binding curve, plot the [Ca2+]free versus emission ratio change (percentage of maximum). Initial cameleons show biphasic Ca2+ dependency, whereas YC6.1 has a monophasic response.
- Extract the apparent dissociation constant (K'd) and Hill coefficient (n) from the fitted curves.
- The emission ratio can then be transformed to
[Ca2+] according to
[Ca2+ ] - K'd [(R - Rmin)/(Rmax - R)]1/n
D. Live Cell Cameleon Fluorescence Imaging
This section describes a Ca2+-imaging experiment using HeLa cells; however, with minor modifications the method can be applied to other cellular and physiological contexts.
- Plate HeLa cells on 35-mm-diameter glassbottom dishes with DMEM-10% FBS media.
- Incubate the cells at 37°C (5% CO2) until cells are 50-80% confluent.
- Transfect cells with the mammalian expression plasmid containing your cameleon using Lipofectamine and PLUS reagents (Invitrogen) according to the manufacturer's instructions.
- Remove the transfection mixture after 5-18 h and replace with fresh 1.5 ml of DMEM-10% FBS media.
- Incubate the cells at 37°C (5% CO2) for 24h. The cells are ready to perform the Ca2+-imaging experiment.
- All data acquisition should be performed in a dark room to reduce background light.
- Wash with 1 ml of HBSS (+CaCl2) and add 1 ml of fresh HBSS (+CaCl2).
- Put the cells on the stage of the microscope. Cells are viable and healthy for at least 60 minutes at ambient conditions. A CO2 box and temperature controller are required for long-term/extended time course experiments.
- The MetaFluor software controls the shutters, filter exchangers, and camera during data acquisition.
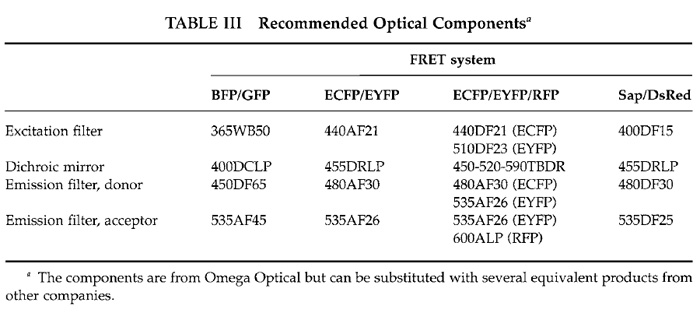
- Screen for EYFP fluorescence (which is brighter and distinguished more easily than ECFP fluorescence) using the eyepiece to find transfected cells expressing the cameleon construct. Turn the filter turret to the U-WNIBA band-pass mirror cube and use ND filter in the range of 0.1-10% to reduce photobleaching depending on the intensity of fluorescence emission (Table III).
- Using the 40× oil objective, center the microscope viewing area on a cell that has a healthy morphology and displays a strong cytosolic fluorescence.
- Acquire single images on the computer screen using MetaFluor while adjusting the focus until you have the sharpest screen image. Focus through the eyepiece and the CCD usually vary slightly.
- Turn the filter turret to the cube with the 455DRLP dichroic mirror. This allows visible light shorter and longer than ~455 nm to be reflected as excitation to the sample and collected as emission from the sample, respectively. Consult spectra from Omega Optical for relatively wavelength transmission efficiencies.
- To monitor the peak emissions of ECFP and EYFP as a result of ECFP peak excitation over time, set the data acquisition conditions as follows: time interval to every 10 s and exposure time to 200 ms for ECFP and EYFP. Longer exposures improve resolution at the expense of bleaching the fluorescent signal. MetaFluor will display the emission ratio over time.
- Draw a region of interest on the field of view of the CCD. Usually, this region will outline the whole cell, but one can specify only a portion of a cell if desired (e.g., the nucleus). It is important that the stage or the cell does not move during the observation period as the region initially drawn may drift from the region of interest. Additionally, the intensity in the region (the signal) should be at least five times the intensity of the background.
- The emission intensities of both ECFP and EYFP will decrease over the course of the experiment due to some unavoidable photobleaching; however, the effect on the emission ratio should be negligible. To reduce photobleaching, decrease exposure time and excitation light intensity. Also, binning can sum the signal from multiple pixels on the CCD camera so that less light is required while keeping a good signal-to-noise ratio.
- MetaFluor will record the fluorescence emission intensities of the ECFP and EYFP, together with their emission ratios in the regions over time.
- When the emission ratio reaches a steady state, add 50µl of 2mM histamine to the culture dish for a final concentration of 100µM. Be careful not to move the culture dish in this process. The histamine binds to cell receptors on the plasma membrane that set off a signaling cascade, resulting in the release of Ca2+ from the endoplasmic reticulum through the inositol-l,4,5- triphosphate receptor. This should cause a conformational change in the cameleon that can be observed by a rise in emission intensity of EYFP and a decline in ECFP intensity. Therefore, the emission ratio should increase. The EYFP/ECFP emission ratio should return to steady-state levels when the effect of the histamine wanes. Figure 2 shows a representative example of MetaFluor software as it is collecting data.
- In order to correlate the emission ratio to [Ca2+]cytosolic, it is necessary to determine Rmin and Rmax so that emission ratios can be mapped to the Ca2+- binding curve. Add 50 µl of 20 µM ionomycin for a final concentration of 1 µM. Ionomycin open pores on the plasma membrane to allow permeability to Ca2+ ions. Because the medium is saturated with CaCl2, the ratio will rise to Rmax. To determine Rmin, add 50µl of 100mM EGTA and 600µM BAPTA-AM for a final concentration of 5mM and 30µM, respectively. The emission ratio should drop to Rmin.
 |
![FIGURE 2 Example of Ca2+ imaging experiment using MetaFluor software. The region of observation is highlighted green in the 440e535 panel. The 440e535 panel and graph plot the change in EYFP fluorescence as a result of ECFP excitation; the 440e480 panel and graph plot the change in ECFP fluorescence as a result of ECFP excitation; the EYFP/ECFP panel and graph are the ratio of 440e535 and 440e480 panels and graphs. In this experiment, the graphs display a sharp rise in [Ca2+]c from the initial stimulation with histamine followed by a slow decline in [CA2+]c to baseline levels. The second stimulation with histamine causes a significantly more rapid return to baseline levels.](images/v2_pb_s08_c40_f02.jpg) |
| FIGURE 2 Example of Ca2+ imaging experiment using MetaFluor software. The region of observation is highlighted green in the 440e535 panel. The 440e535 panel and graph plot the change in EYFP fluorescence as a result of ECFP excitation; the 440e480 panel and graph plot the change in ECFP fluorescence as a result of ECFP excitation; the EYFP/ECFP panel and graph are the ratio of 440e535 and 440e480 panels and graphs. In this experiment, the graphs display a sharp rise in [Ca2+]c from the initial stimulation with histamine followed by a slow decline in [CA2+]c to baseline levels. The second stimulation with histamine causes a significantly more rapid return to baseline levels. |
IV. OTHER APPROACHES
Several other Ca2+ probes are also being developed, including the so-called "camgaroos" and "pericams." Camgaroos take an alternative approach to designing fluorescent Ca2+ sensors based on CaM and GFP family members (Baird et al., 1999). While ECFP and EYFP in cameleons are appended to the amino and carboxyl termini of CaM and Ca2+ binding is detected by FRET, camgaroo indicator proteins take advantage of the robust structure and profound fluorescence sensitivity of GFP to altered pKa values and chromophore orientation. Circular permutations and insertion of whole CaM in place of Tyr-145 within EEYFP thereby render this indicator responsive to Ca2+ binding. As a result, both excitation and emission spectra of camgaroo simply increase in amplitude by up to seven-fold upon saturation with Ca2+, without any significant shift in peak wavelength. This Ca2+-dependent fluorescence enhancement is substantially larger than other published genetically encoded fluorescent indicators. However, camgaroos are limited by pH sensitivity inherent in the current mechanism of modulating fluorescence via changes in pKa of the chromophore and have to date only been preliminarily subjected to systematic mutational improvement.
Pericams, in which EYFP is circularly fused to CaM and the M13 myosin light chain kinase peptide, improve approximately 10-fold upon the low affinity of camgaroo for Ca2+ (Kd = 7 µM) and are thereby better capable of sensing low physiological changes in intracellular [Ca2+] (Nagai et al., 2001). Taken together, these strategies offer alternatives complementary to cameleons for creating genetically encoded, physiological Ca2+ indicators.
V. OTHER CONSIDERATIONS AND PITFALLS
A. Ca2+ Ion Sensitivity
Although cameleon probes vary in their Ca2+ affinities, most are suitable for monitoring [Ca2+] between 0.5 and 100 µM. This poses a problem for examining the relatively high [Ca2+] found in the endoplasmic reticulum of resting cells (approximately 500 µM). However, CaM mutagenesis studies have shown that substitution of a conserved glutamic acid residue at the 12th position of each Ca2+-binding loop abolishes its Ca2+-binding ability (Zhu et al., 1998). The effect of combinations of these mutations on cameleon Ca2+ range is currently being examined further in our laboratory.
B. Maturation
GFP variants have been developed in which chromophore oxidative maturation (and thereby become fluorescent) occurs more quickly and efficiently at 37°C. It would be advantageous to utilize efficiently folding versions, such as the recently developed "Venus" form of EYFP (F46L/F64L/M153T/V163A/ S175G). These EYFP mutations confer an eight-fold increase of fluorescence intensity when expressed in mammalian cells (Nagai et al., 2002; Rekas et al., 2002). This will enable assay of cells 24 h postrecovery transfection, if so desired.
C. pH Sensitivity
The hydrogen bond network within the 13 barrel of the chromophore is sensitive to external pH. Hence, in order to analyze Ca2+ levels in acidic organelles (such as secretory vesicles), the FRET donor/acceptor pair must be engineered so that it is pH resistant. Two mutations within EEYFP (V68L and Q69K) have been shown to decrease its pKa to 6.1 (Miyawaki et al., 1999). The pH sensitivity was improved further via a Q69M or "citrine" mutation (pKa 5.7; Griesbeck et al., 2001). Another approach would be to change the donor/acceptor pair to the pH-insensitive sapphirered cameleon probe (SapRC2). Although this construct has a tendency to aggregate and form homotetramers, the recent engineering of a monomeric mRFP1 offers an interesting alternative (Campbell et al., 2002).
D. Oligomerization
GFP family proteins have been observed to form obligate dimers and may thereby generate falsepositive FRET signals. However, this aggregation problem need not preclude their use in biological systems, even when present in higher local concentrations. Nonoligomerizing mutants of EYFP have been suggested from its crystal structure (Wachter et al., 1998; Rekas et al., 2002), but these have yet to be validated experimentally. Alternatively, using a monomeric version of the evolutionary distinct RFP (mRFP1) in tandem with a EYFP donor would also serve to eliminate this issue (Campbell et al., 2002).
E. Influences on Biological Systems
It is very important to consider potential competition of the FRET indicator for native CaM or CaMdependent enzymes. Previous comparisons of the effect of recombinant CaM and cameleon chimeras on prototypical CaM-dependent enzymes have revealed that the primary effect of cameleons is on buffering [Ca2+] and not interfering with CaM-mediated signaling (Miyawaki et al., 1999). This could be due to the CaM component of the cameleon being inhibited by the adjoining CKKp efficiently occupying its substratebinding site. Also, as the YC6.1 CKKp is embedded within the cameleon polypeptide, it is not likely to interact with endogenous CaM proteins.
F. Interpretation of Live Cell FRET Data
There are two commonly used simple and practical approaches. The first, measurement of donor emission quenching and acceptor emission enhancement by using three filter sets and then mathematical processing to determine emission/FRET ratios, is described in Section III. The alternative approach is by detection of donor dequenching following acceptor bleaching. We find bleaching with a minimum of 200ms, compared to 1 ms for control excitation, is sufficient.
G. Additional Ways to Do Ratio Imaging
FRET requires rapid intensity measurements at different wavelengths. Switching time (in the millisecond range) may be an important parameter for some applications. New imaging systems have become available in the marketplace, notably TILLvisION (T.I.L.L. Photonics) and AquaCosmos (Hamamatsu), which allow for excellent time resolution for fluorescenceintensity ratio imaging.
H. FRET Using Red Fluorescence Protein
For YC6.1 applications, the ECFP-EYFP FRET filter set is sufficient. However, if you are using RFP for FRET, the following dichoric mirrors and filters from Omega Optical (or equivalents) will be needed: 450- 520-590TBDR for the dichoric mirror; 440DF21 for ECFP excitation; 510DF23 for EYFP excitation; 575DF26 for RFP excitation; 480AF30 for ECFP emission; 535AF26 for EYFP emission; and 600ALP for RFP emission. This filter set allows you to excite or acquire emission from ECFP, EYFP, and RFP individually, albeit with a tradeoff in efficiency.
I. Imaging Systems
Using a confocal microscope is the best way to increase spatial resolution for FRET experiments. Confocal YC6.1 measurements can be performed with single-photon excitation using the 458-nm line of an argon laser, but much more efficient excitation of ECFP is attained with the 442-nm line of a HeCd laser. Twophoton excitation microscopy, in addition to providing optical sections of a specimen as with confocal microscopy, offers certain advantages. Its applicability to cameleons has been demonstrated using video-rate scanning instrumentation (Fan et al., 1999). This latter imaging approach may not be readily available to most laboratories, however.
J. Preparation of Ca2+/EGTA Buffers
The accuracy of the Ca2+-binding curve depends on accurate preparation of the Ca2+/EGTA and Ca2+/HEEDTA systems below 10-5M free Ca2+ and unbuffered Ca2+ above (Bers et al., 1994). The purity of EGTA, temperature, and pH are all practical issues.
Acknowledgments
We are grateful to Atsushi Miyawaki for his help in setting up a FRET microscope system in our laboratory, as well as for much advice on the use of GFP variants. This work was supported by grants from the Cancer Research Society Inc. and the Institute for Cancer Research of the Canadian Institutes of Health Research (CIHR). K.P.H. is a recipient of a NCIC Research Fellowship, K.T. holds a CIHR scholarship, and M.I. is a CIHR senior investigator.
References
Allen, G. J., Kwak, J. M., Chu, S. P., Llopis, J., and Tsien, R. Y. (1999). Cameleon calcium indicator reports cytoplasmic calcium dynamics in Arabidopsis guard cells. Plant J. 19, 735-747.
Baird, G. S., Zacharias, D. A., and Tsien, R. Y. (1999). Circular permutation and receptor insertion within green fluorescent proteins. Proc. Natl. Acad. Sci. USA 96, 11241-11246.
Bers, D. M., Patton, C. W., and Nuccitelli, R. (1994). A practical guide to the preparation of Ca2+ buffers. Methods Cell Biol. 40, 3-29.
Campbell, R. E., Tour, O., Palmer, A. E., Steinbach, P. A., Baird, G. S., Zacharias, D. A., and Tsien, R. Y. (2002). A monomeric red fluorescent protein: Proc. Natl. Acad. Sci. USA 99, 7877-7882.
Carafoli, E. (2003). The calcium-signalling saga: Tap water and protein crystals. Nature Rev. Mol. Cell Biol. 4, 326-332.
Demaurex, N., and Frieden, M. (2003). Measurements of the free luminal ER Ca(2+) concentration with targeted "cameleon" fluorescent proteins. Cell Calcium 34, 109-119.
Emmanouilidou, E., Teschemacher, A. G., Pouli, A. E., Nicholls, L. I., Seward, E. P., and Rutter, G. A. (1999). Imaging Ca2+ concentration changes at the secretory vesicle surface with a recombinant targeted cameleon. Curr. Biol. 9, 915-918.
Fan, G. Y., Fujisaki, H., Miyawaki, A., Tsay, R. K., Tsien, R. Y., and Ellisman, M. H. (1999). Video-rate scanning two-photon excitation fluorescence microscopy and ratio imaging with cameleons. Biophys. J. 76, 2412-2420.
Griesbeck, O., Baird, G. S., Campbell, R. E., Zacharias, D. A., and Tsien, R. Y. (2001). Reducing the environmental sensitivity of yellow fluorescent protein: Mechanism and applications. J. Biol. Chem. 276, 29188-29194.
Grynkiewicz, G., Poenie, M., and Tsien, R. Y. (1985). A new generation of Ca2+ indicators with greatly improved fluorescence properties. J. Biol. Chem. 260, 3440-3450.
Ikeda, M., Sugiyama, T., Wallace, C. S., Gompf, H. S., Yoshioka, T., Miyawaki, A., and Allen, C. N. (2003). Circadian dynamics of cytosolic and nuclear Ca2+ in single suprachiasmatic nucleus neurons. Neuron 38, 253-263.
Isshiki, M., Ying, Y. S., Fujita, T., and Anderson, R. G. (2002). A molecular sensor detects signal transduction from caveolae in living cells. J. Biol. Chem. 277, 43389-43398.
Kerr, R., Lev-Ram, V., Baird, G., Vincent, P., Tsien, R. Y., and Schafer, W. R. (2000). Optical imaging of calcium transients in neurons and pharyngeal muscle of C. elegans. Neuron 26, 583-594.
Liu, L., Yermolaieva, O., Johnson, W. A., Abboud, E M., and Welsh, M. J. (2003). Identification and function of thermosensory neurons in Drosophila larvae. Nature Neurosci. 6, 267-273.
Miyawaki, A. (2003). Visualization of the spatial and temporal dynamics of intracellular signaling. Dev. Cell 4, 295-305.
Miyawaki, A., Griesbeck, O., Heim, R., and Tsien, R. Y. (1999). Dynamic and quantitative Ca2+ measurements using improved cameleons. Proc. Natl. Acad. Sci. USA 96, 2135-2140.
Miyawaki, A., Llopis, J., Heim, R., McCaffery, J. M., Adams, J. A., Ikura, M., and Tsien, R. Y. (1997). Fluorescent indicators for Ca2+ based on green fluorescent proteins and calmodulin. Nature 388, 882-887.
Mizuno, H., Sawano, A., Eli, P., Hama, H., and Miyawaki, A. (2001). Red fluorescent protein from Discosoma as a fusion tag and a partner for fluorescence resonance energy transfer. Biochemistry 40, 2502-2510.
Montero, M., Brini, M., Marsault, R., Alvarez, J., Sitia, R., Pozzan, T., and Rizzuto, R. (1995). Monitoring dynamic changes in free Ca2+ concentration in the endoplasmic reticulum of intact cells. EMBO J. 14, 5467-5475.
Nagai, T., Ibata, K., Park, E. S., Kubota, M., Mikoshiba, K., and Miyawaki, A. (2002). A variant of yellow fluorescent protein with fast and efficient maturation for cell-biological applications. Nature Biotechnol. 20, 87-90.
Nagai, T., Sawano, A., Park, E. S., and Miyawaki, A. (2001). Circularly permuted green fluorescent proteins engineered to sense Ca2+. Proc. Natl. Acad. Sci. USA 98, 3197-31202.
Rekas, A., Alattia, J. R., Nagai, T., Miyawaki, A., and Ikura, M. (2002). Crystal structure of venus, a yellow fluorescent protein with improved maturation and reduced environmental sensitivity. J. Biol. Chem. 277, 50573-50578.
Truong, K., and Ikura, M. (2001). The use of FRET imaging microscopy to detect protein-protein interactions and protein conformational changes in vivo. Curr. Opin. Struct. Biol. 11, 573-578.
Truong, K., Sawano, A., Mizuno, H., Hama, H., Tong, K. I., Mal, T. K., Miyawaki, A., and Ikura, M. (2001). FRET-based in vivo Ca2+ imaging by a new calmodulin-GFP fusion molecule. Nature Struct. Biol. 8, 1069-1073.
Wachter, R. M., Elsliger, M. A., Kallio, K., Hanson, G. T., and Remington, S. J. (1998). Structural basis of spectral shifts in the yellow-emission variants of green fluorescent protein. Structure 6, 1267-1277.
Zhang, J., Campbell, R. E., Ting, A. Y., and Tsien, R. Y. (2002). Creating new fluorescent probes for cell biology. Nature Rev. Mol. Cell. Biol. 3, 906-918.
Zhu, T., Beckingham, K., and Ikebe, M. (1998). High affinity Ca2+ binding sites of calmodulin are critical for the regulation of myosin Ibeta motor function. J. Biol. Chem. 273, 20481-20486.
Support our developers


