Pigment Distribution in PSII and PSI Super-Complexes of Algal Division
Absorption spectra can give us information about the spectral range in which pigment molecules organized in the thylakoid membranes capture photons. Absorption spectra in the visible range, from 400 to 700 nm, have been measured in vivo on photosynthetic compartments (thylakoid membranes and chloroplasts) of single cells belonging to each algal division. Each spectrum represents the envelope of the real absorption data, and is coupled to the plot of the fourth-derivative absorption spectrum. This mathematical tool allows the resolution of absorption maxima relative to the different components of the pigment moiety characterizing the division, which cannot be detected in the envelope spectrum because of the overlapping of their multiple spectra. These components have been grouped and related to the following pigment classes: chlorophylls
a,
b,
c1, and
c2, carotenoids, cytochromes, and phycobiliproteins. Each pigment possesses its own distinctive absorption spectrum in the visible range, which have been decomposed in its Gaussian bands and relative absorption maxima. By relating the absorption maxima resolved by means of fourth-derivative analysis with the absorption maxima of the Gaussian bands of the different pigments, it is
possible to both predict the presence of a specific pigment in an alga and give an unknown alga a plausible taxonomic framing.
Chlorophylls and cytochromes always show the same absorption maxima independently of the algal division, though the intensity of their absorption bands may change; phycobiliproteins, carotenoids, and xanthophylls show a variable distribution of their single components, which is characteristic of each algal division. Figure 3.5–Figure 3.8 show the absorption spectra of the photosynthetic compartments in all the different algal divisions. The absorption spectrum of the tissue of a higher plant (Hedysarum coronarium) is shown for highlighting the uniformity of the pigment distribution throughout the algal green lineage and plants.
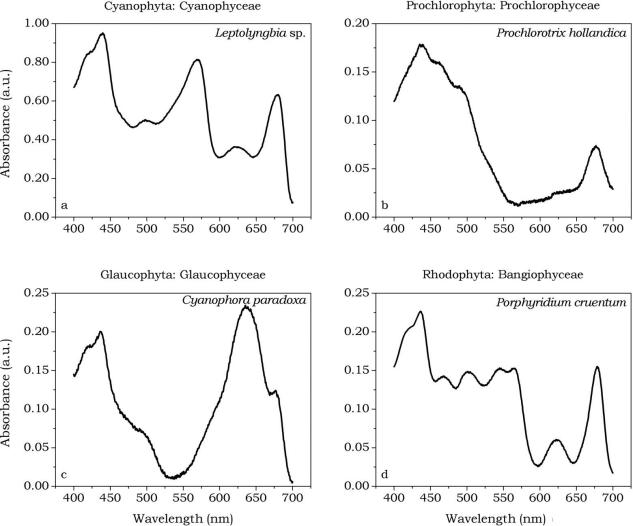
FIGURE 3.5 In vivo absorption spectra of photosynthetic compartments of Cyanophyta (a), Prochlorophyta (b), Glaucophyta (c), and Rhodophyta (d).
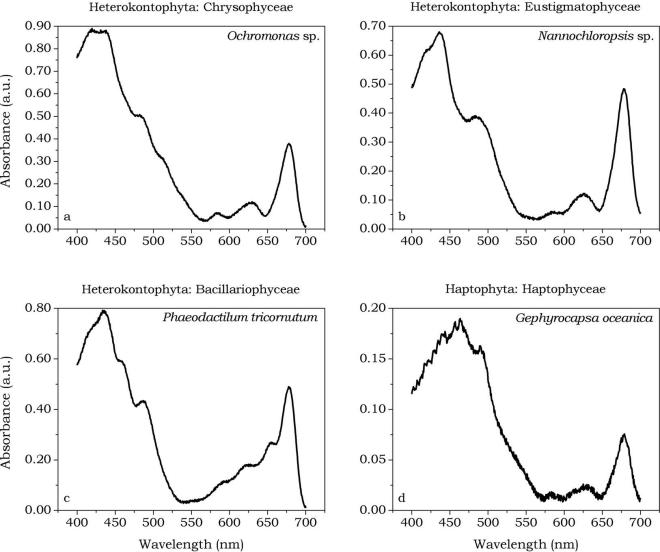
FIGURE 3.6 In vivo absorption spectra of photosynthetic compartments of Heterokontophyta (a, b, and c) and Haptophyta (d).
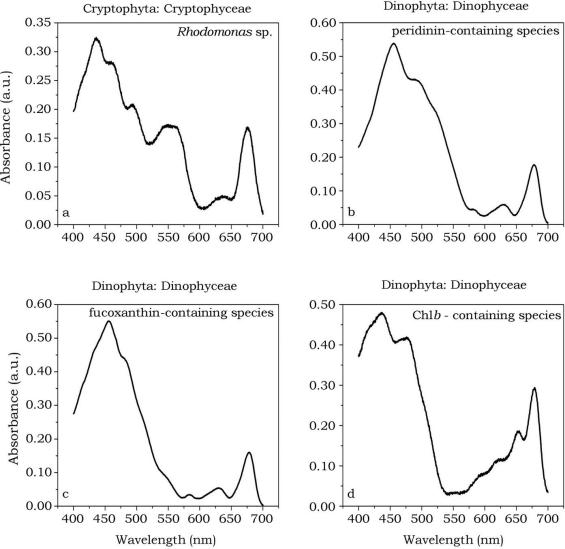
FIGURE 3.7 In vivo absorption spectra of photosynthetic compartments of Cryptophyta (a) and Dinophyta (b, c, and d).
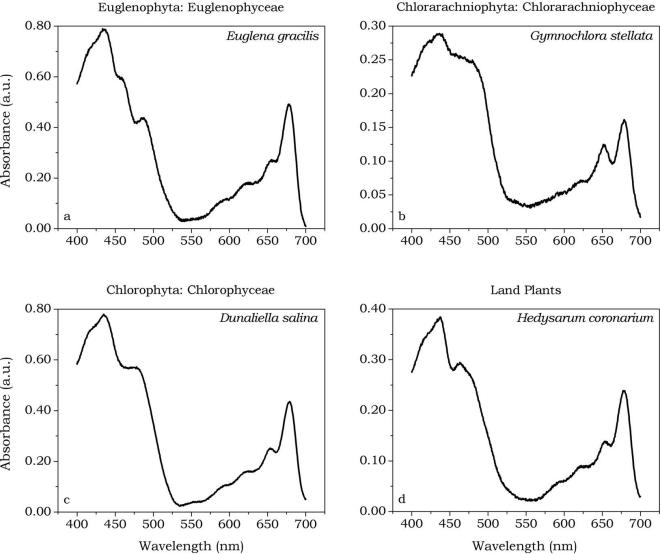
FIGURE 3.8 In vivo absorption spectra of photosynthetic compartments of Euglenophyta (a), Chloraracnophyta (b), Chlorophyta (c), and Land Plants (d).
It should be stressed that all the pigments other than chlorophyll a perform two main functions: protection of photosynthetic assemblies from photosensitization processes (mainly carotenoids); absorption of light at wavelengths other than those absorbed by chlorophyll a and transfer of its energy to P
680 and P
700.


